Performance Analysis
Note
The Performance Analysis section is part of the paid subscription license. To access it, purchase the Process Analytics Suite license, or apply for a 60-day Free trial.
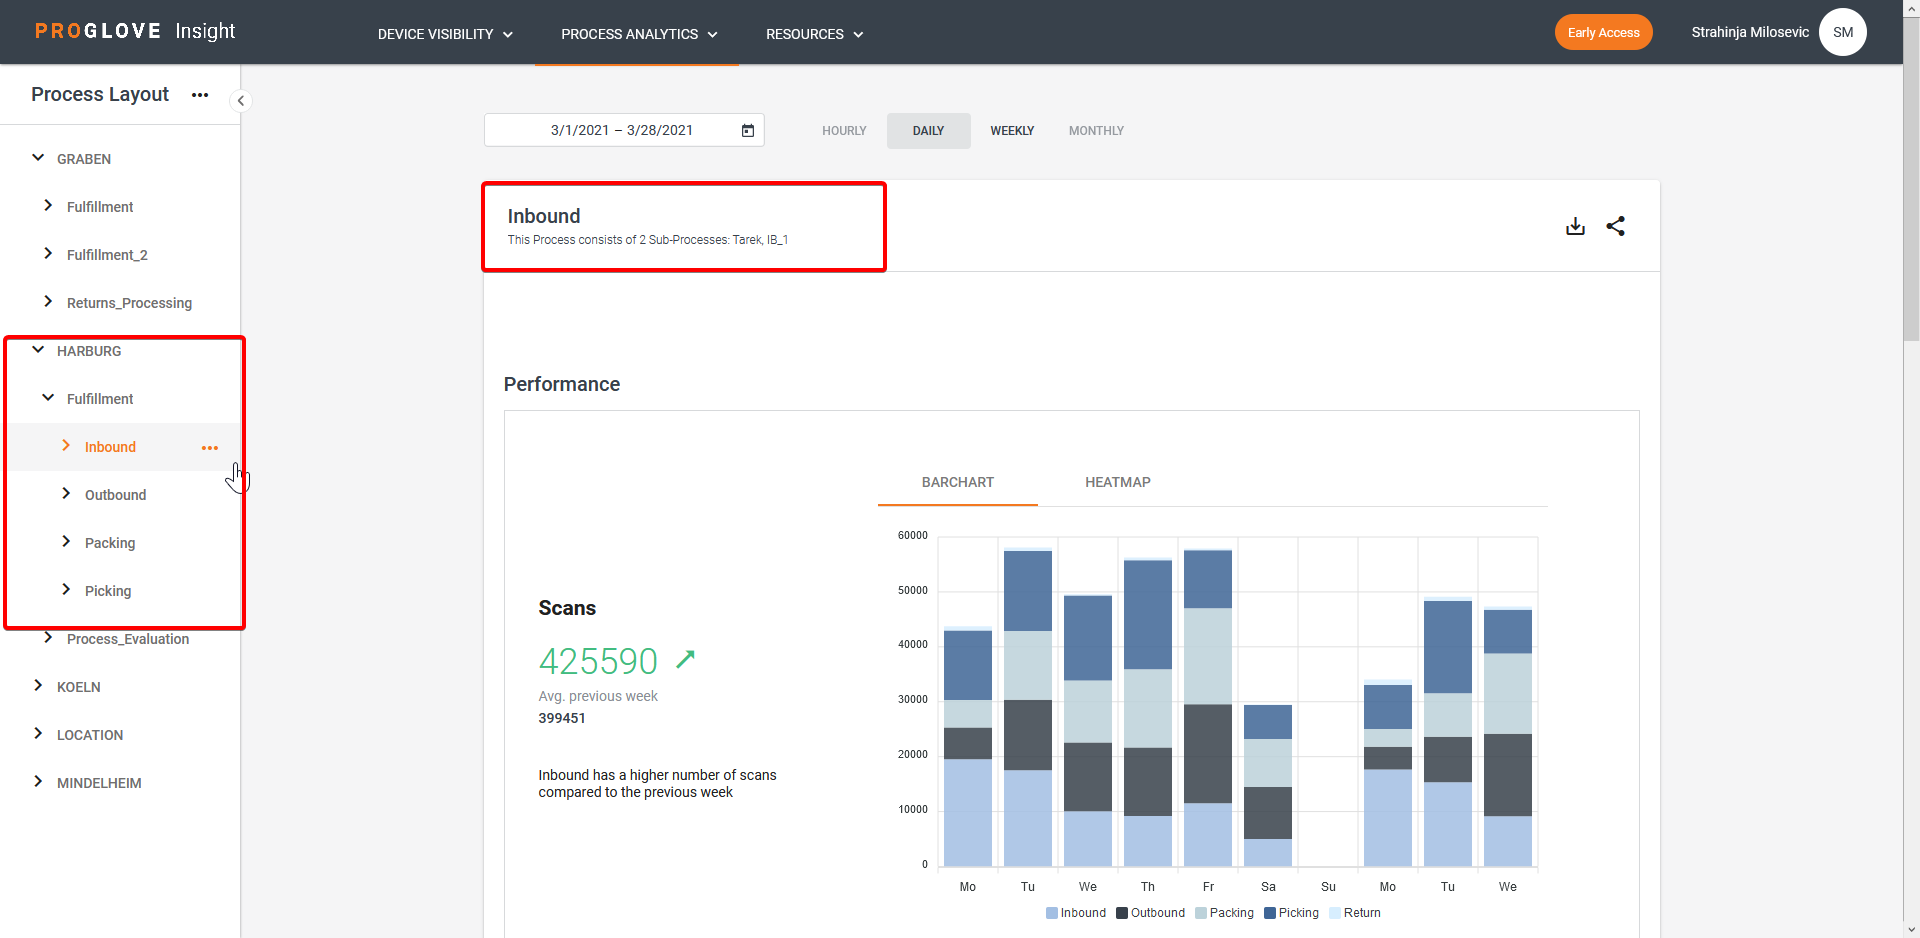
The Performance Analysis section provides you with insight into your process and devices key statistics relative to the selected level of your Process Layout hierarchy.
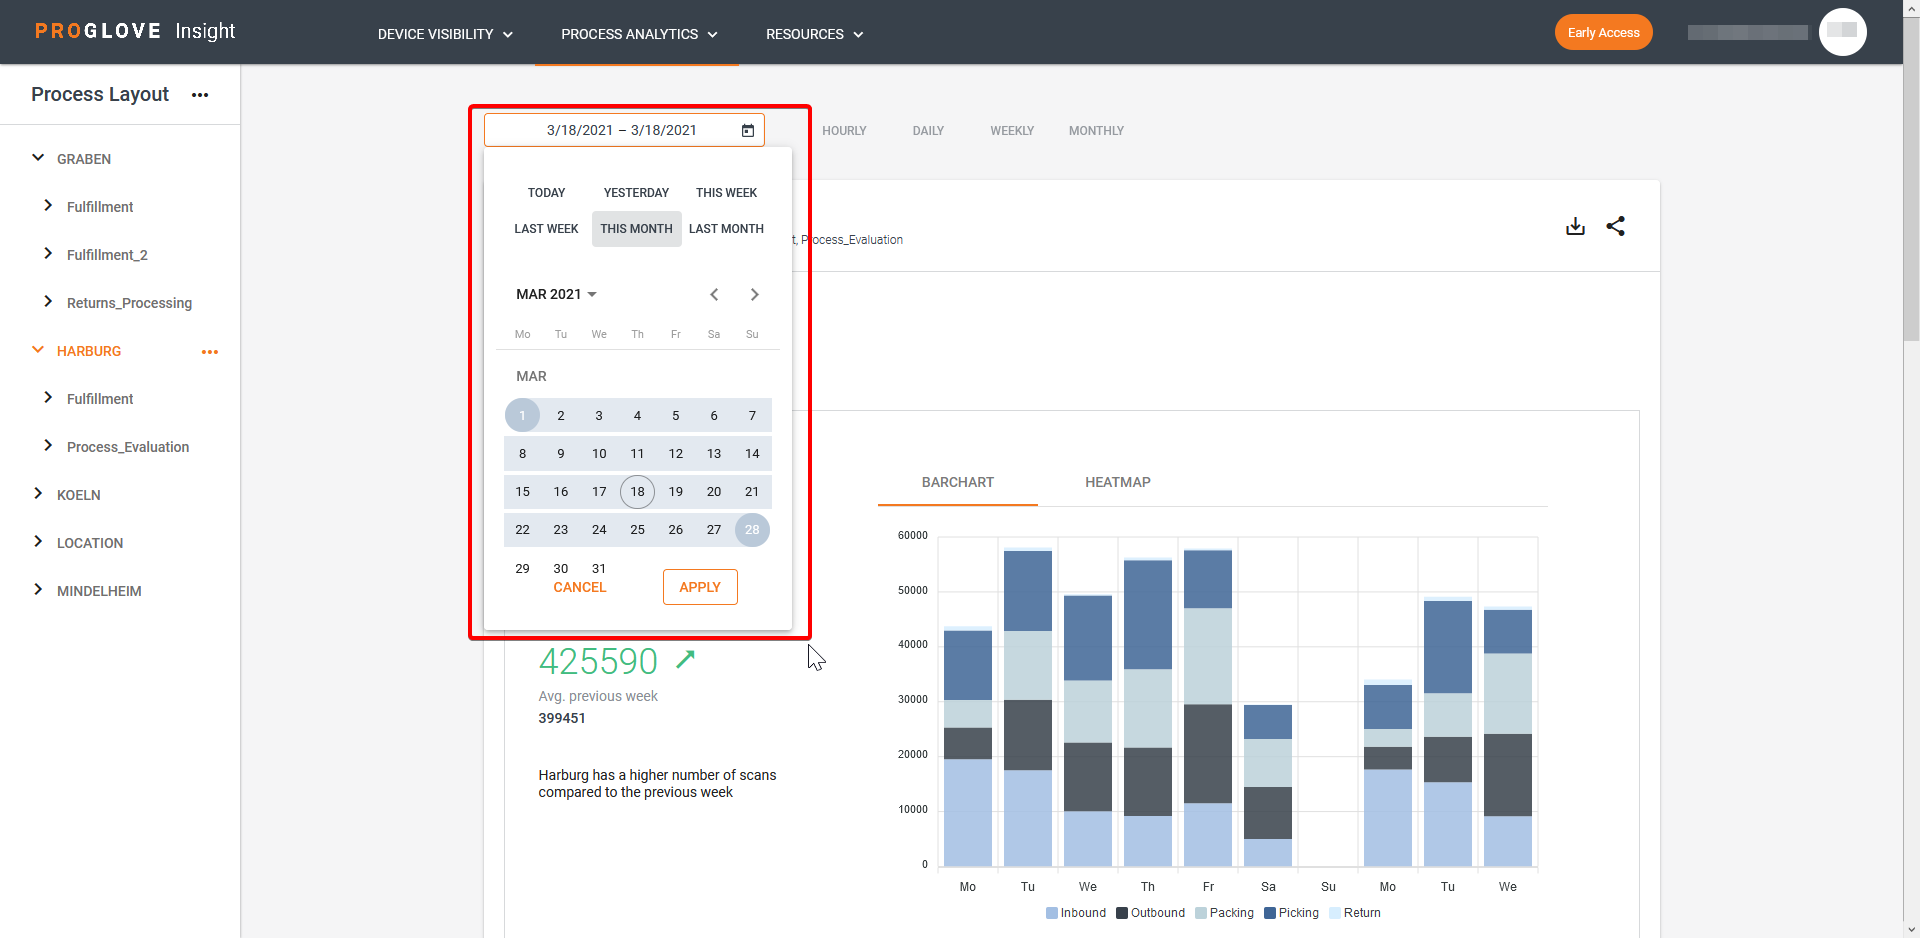
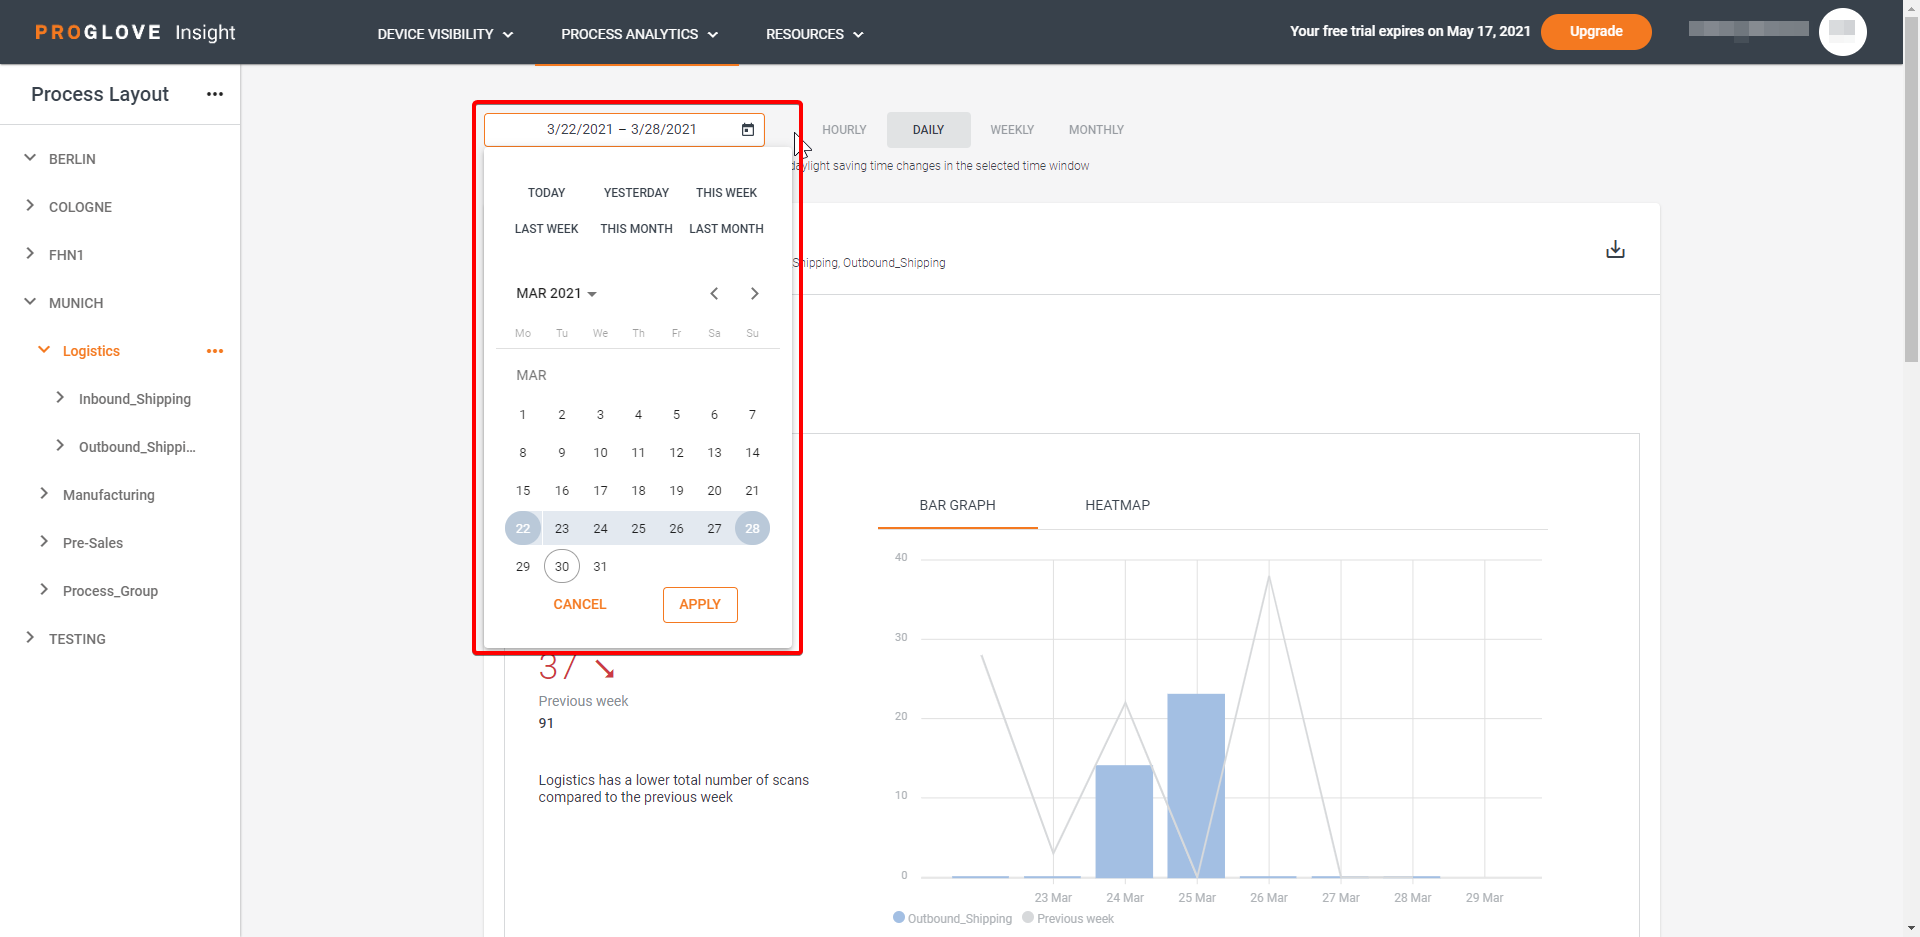
To display the data crucial to your work processes, select the desired Process Layout level and time frame.
After you select the Process Layout level and time frame, the Performance and Effort sections display the Scan, Movement, and Time scanning metrics with the following components:
Graph visualization - The graphs display the respective measurement over the selected time frame and the selected Process Layout level. Each color in the graph is assigned to one underlaying layer of the selected Process Layout level and the size displays how much it contributed to the overall number. Clicking on the different labels in the graph legend hides or highlights different underlaying layers.
Overall number - The number next to the graph is the accumulated value of the selected time frame and the selected Process Layout level.
Trend - If the default time range is selected in the time picker (e.g. Today, This week, etc.) the green, red, or grey arrow is indicating a positive, negative, or neutral trend in comparison to the historic reference time range.
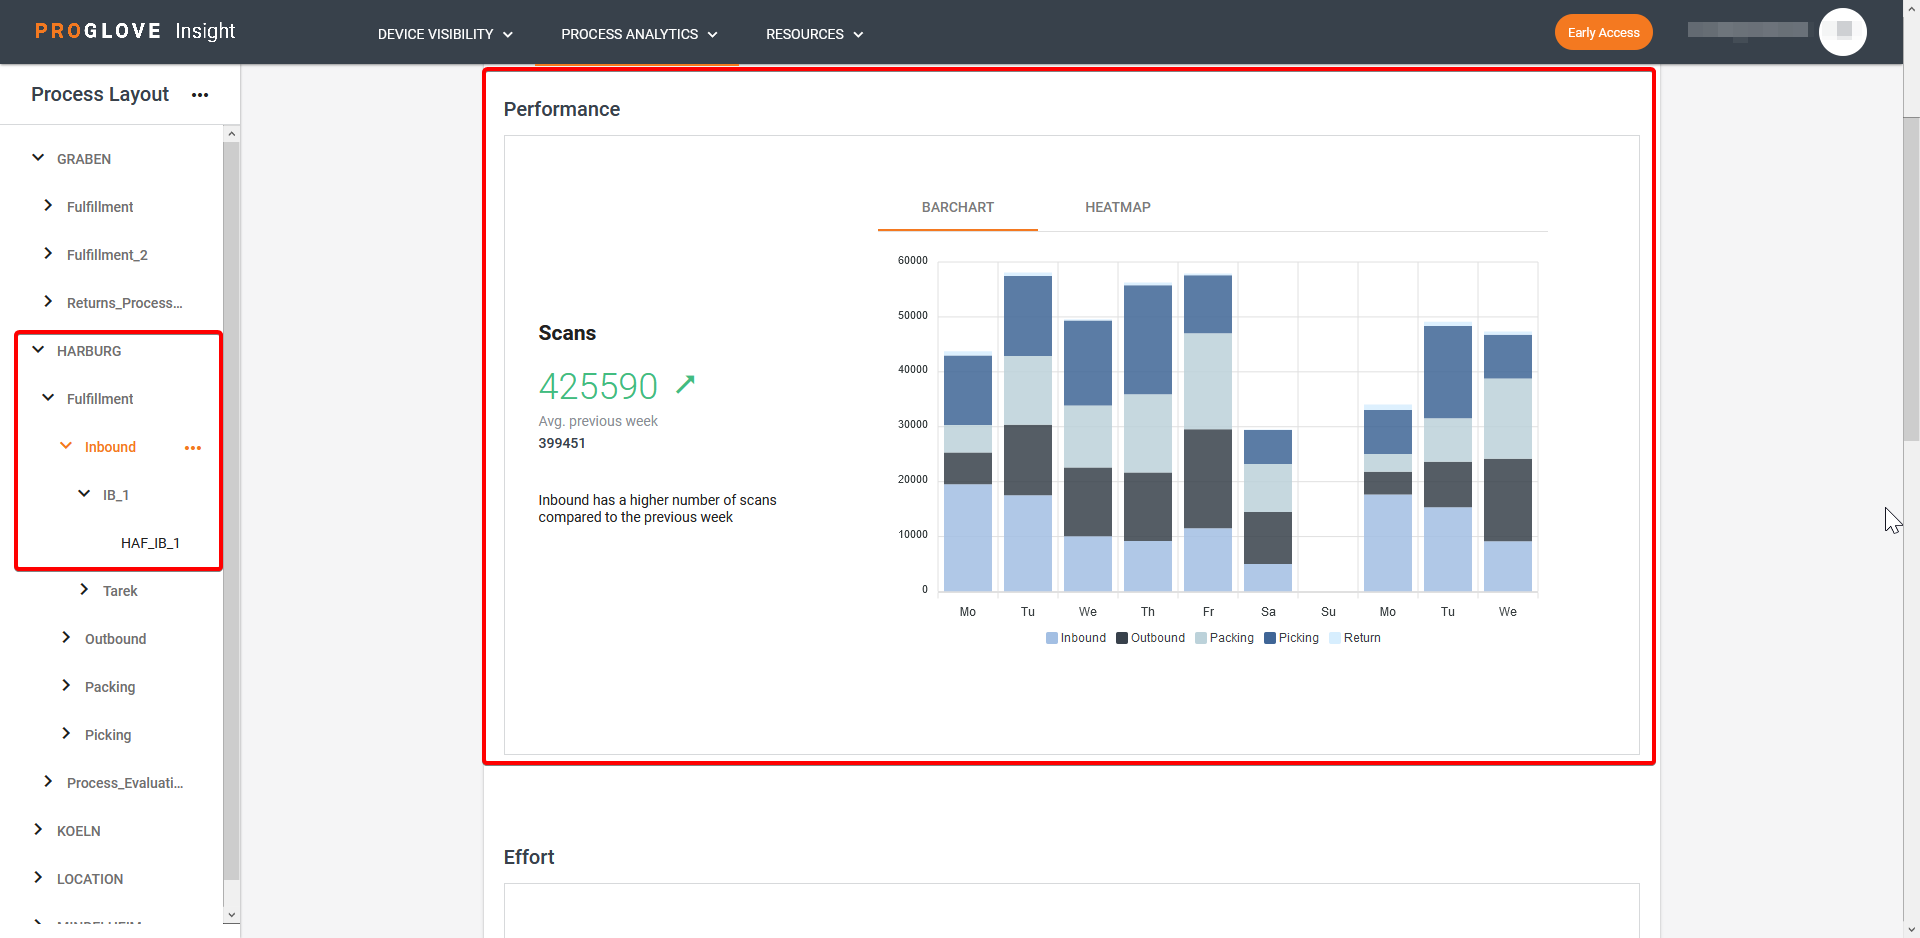
Performance
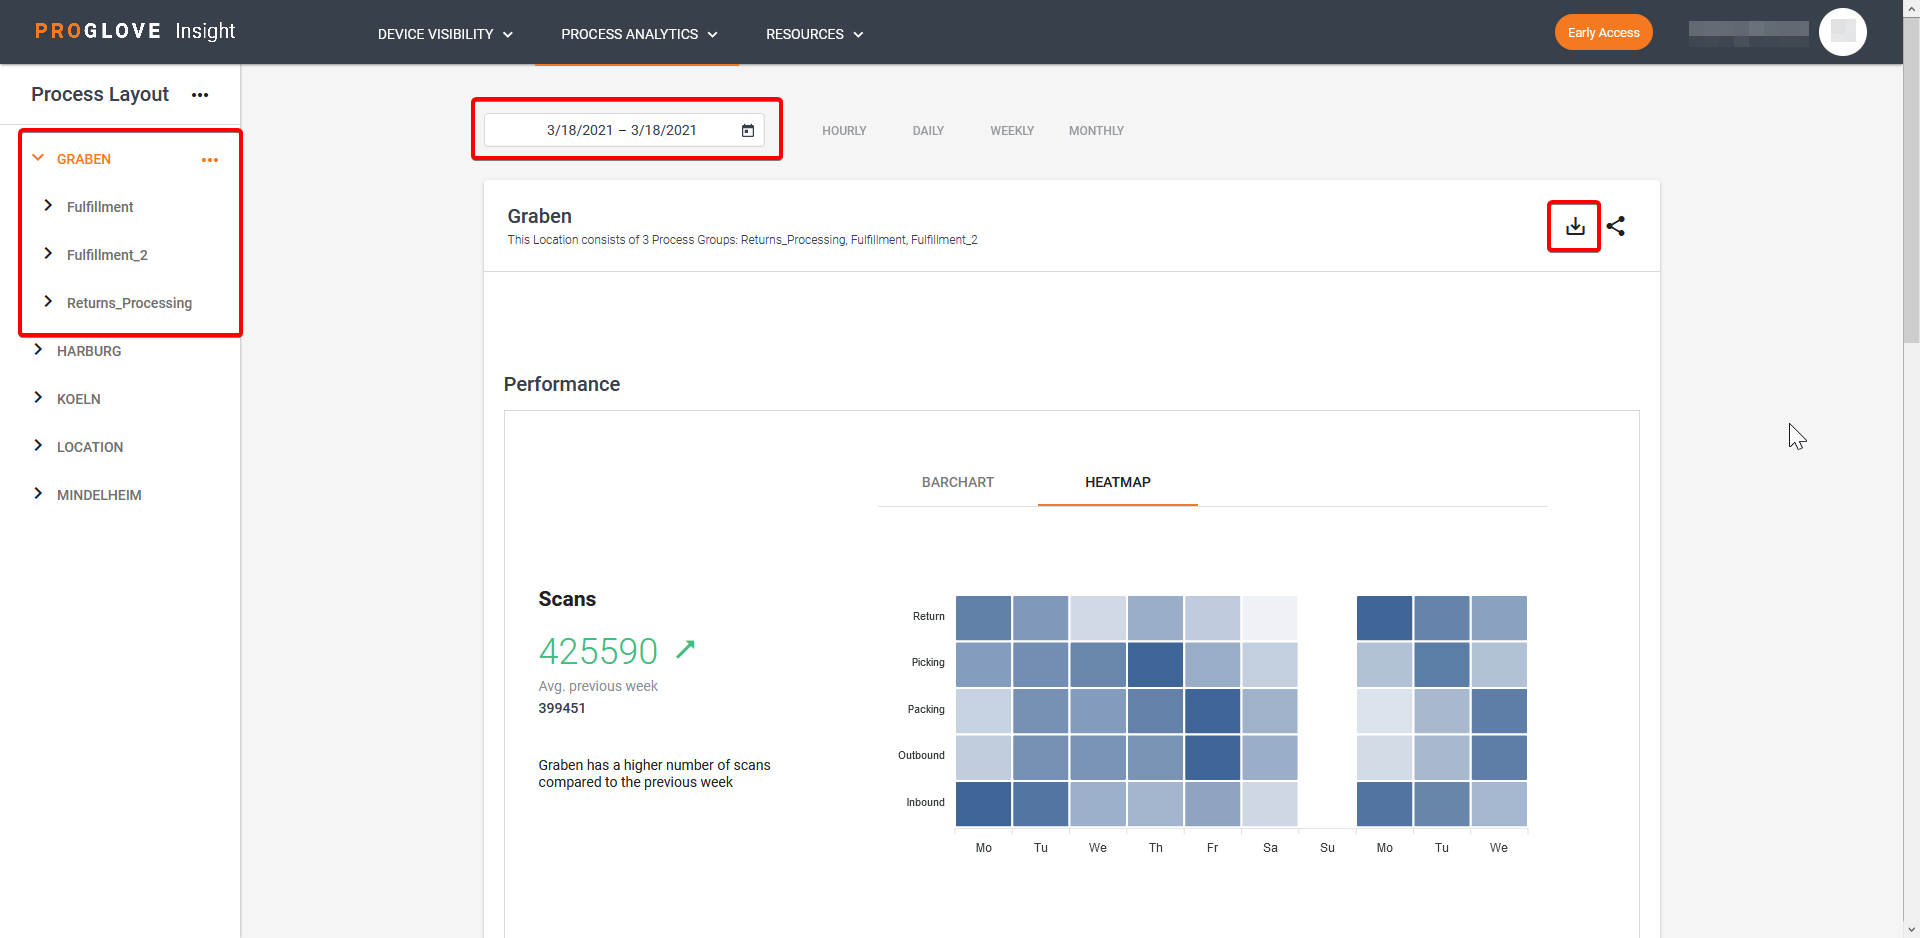
The Performance section displays the number of Scans made under the selected Process Layout level for the selected time frame.
Effort
The Effort section displays the Movement and Time scanning metrics.
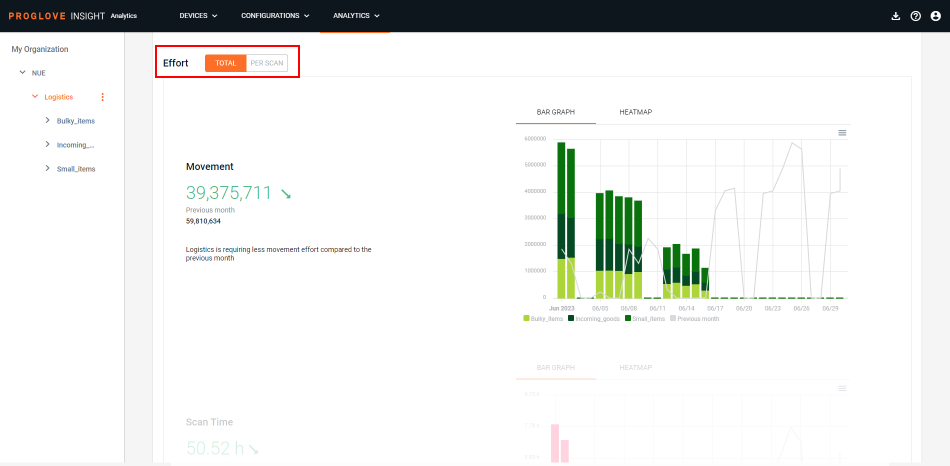
The Movement chart helps you visualize the total movement effort made by your workforce of the selected Process Layout level in the selected time frame. The Movement effort includes the total number of steps (distance walked) by your workforce as well as any additional effort needed for the process-related movements (e.g. picking and packing).
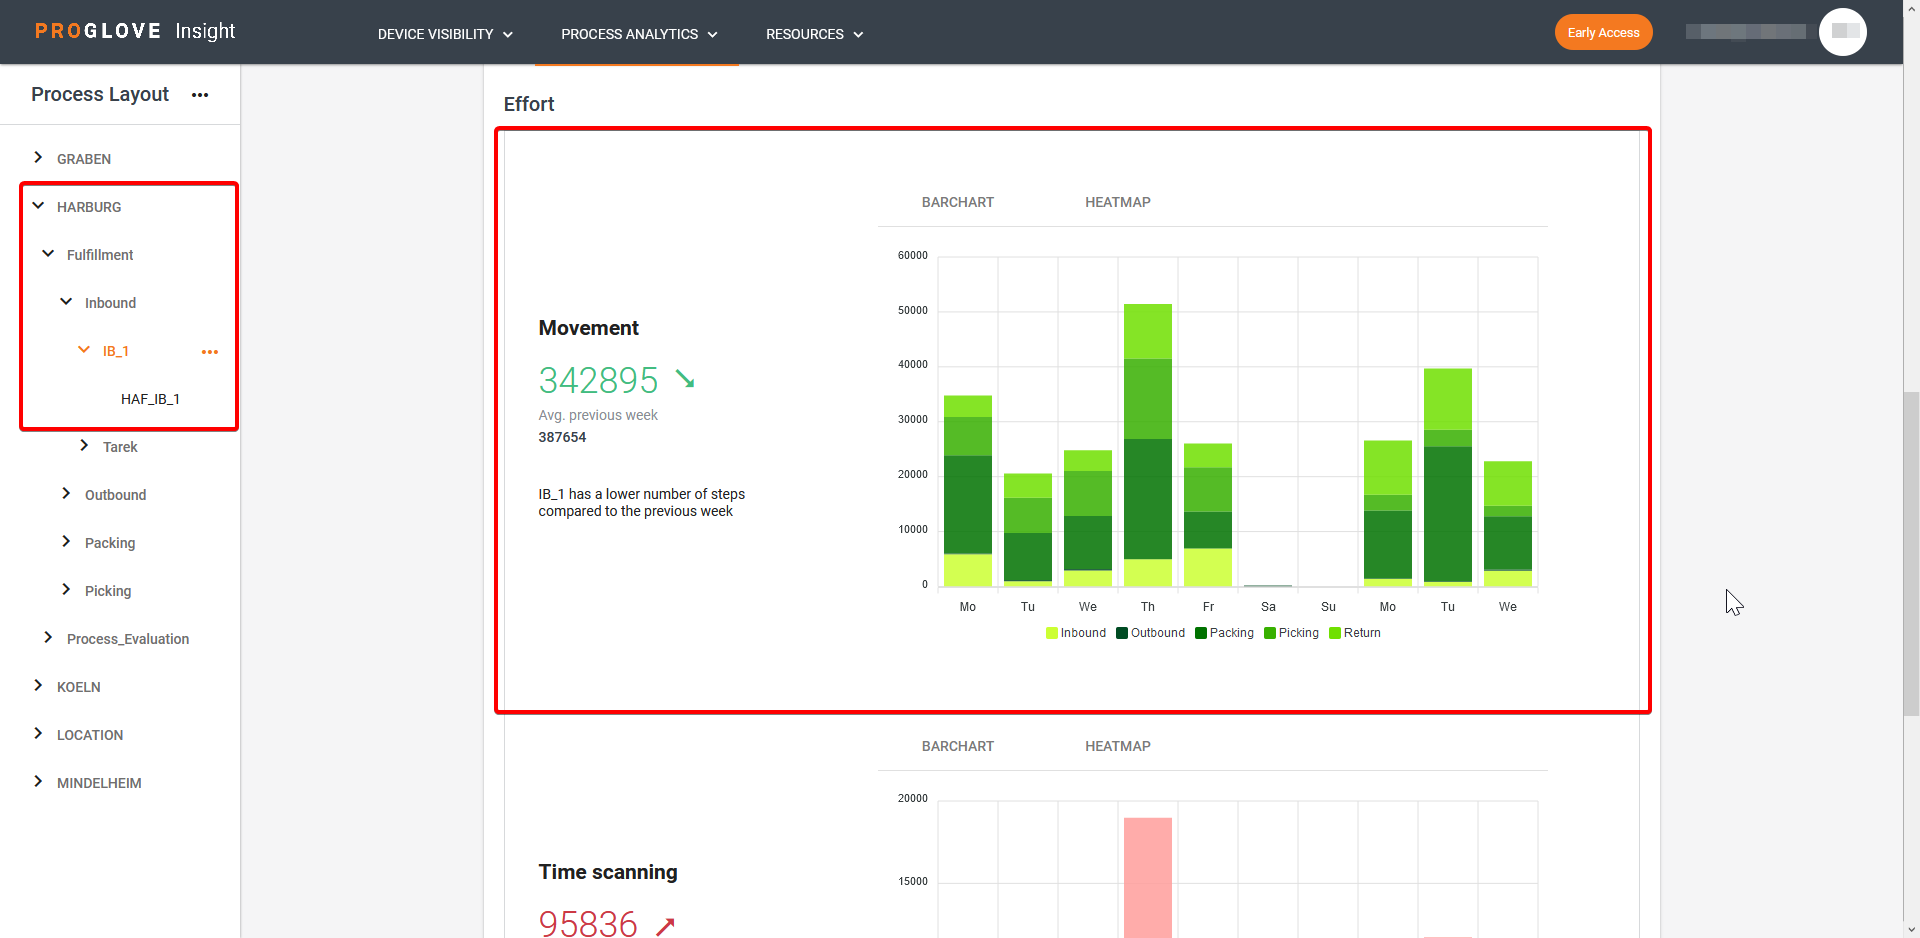
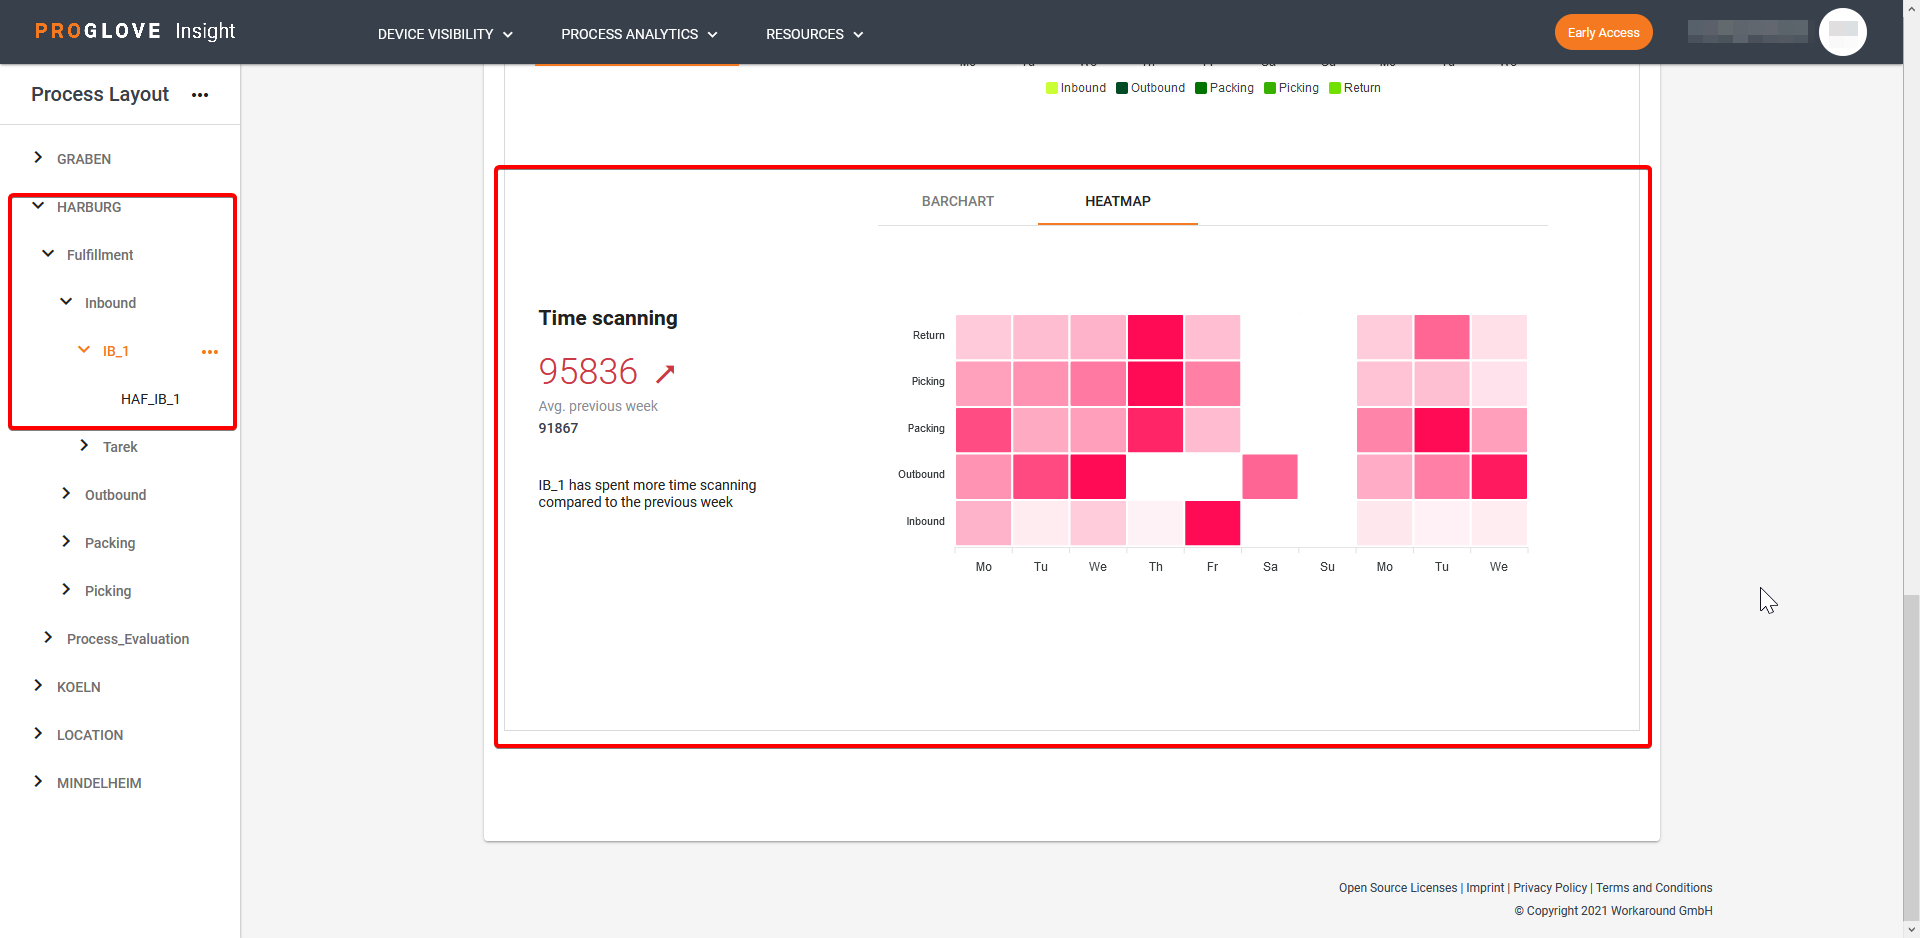
The Time scanning chart displays the overall time of all scanning-related efforts under the selected Process Layout level in the selected time frame. This includes the time from pressing the scanning button to the decoding of the barcode in case of successful scans, as well as the time spent on all unsuccessful scanning attempts of the same barcode (e.g. in case of damaged barcodes).
Use the toggle at the top of the Effort section to display the Movement and Time scanning statistics of the selected Process Layout level for the Total workforce or Per Scan for the selected time frame.
Note
To help you visualize the statistics, you can select to display the data in forms of a bar chart or a heatmap.
Export data
You can export the data for the selected Process Layout level and time frame in a .csv file.
In the Process Layout, select a hierarchy level.
At the top of the page, click on the date picker to select the desired time frame.
Note
The exported .csv file can contain up to 30 days of data.
In the top right, click the download icon.
The Download Event History modal window displays.
Select DOWNLOAD.
A .csv file downloads with the data for the selected parameters.
Note
The export is a semicolon delimited .csv file where the events are displayed in rows while the features are displayed in columns.
Exported data-points
There are two types of raw data events:
Scan events - contain all scanning-related data and metadata
Telemetry events - contain all metadata collected between scans.
Available columns in the exported .csv file
Measurement | Data type | When it is collected | Description |
|---|---|---|---|
|
| scan and telemetry event | Unique ID of the event |
|
| scan and telemetry event | Type of event |
|
| scan and telemetry event | UNIX timestamp |
|
| scan and telemetry event | Human-readable time stamp |
|
| scan event | Scanned barcode |
|
| scan event | Symbology of the scanned code |
|
| scan event | Trigger time in seconds |
|
| scan event | Movement effort of all steps as well as additional movement measured by the scanner (e.g. picking, packing efforts) |
|
| scan and telemetry event | Scanning device’s serial number |
|
| scan and telemetry event | Percentage of the scanning device’s battery levels |
|
| scan and telemetry event | The scanning device’s firmware version |
|
| scan and telemetry event | ID of the collecting connectivity device |
|
| scan and telemetry event | Customer’s chosen name for the collecting connectivity device |
|
| scan and telemetry event | Customer’s chosen name for the station of the collecting connectivity device (deprecated, replaced by levels and organization names) |
|
| scan and telemetry event | Customer’s chosen name for the use case of the collecting connectivity device (deprecated, replaced by levels and organization names) |
|
| scan and telemetry event | Full path of the collecting connectivity device, the IDs of the parent levels concatenated with a ‘#’ character at the time of ingestion |
|
| scan and telemetry event | Full list of the customer’s chosen names for the parent levels of the collecting connectivity device at the time of ingestion |
|
| scan and telemetry event | Thing name of the collecting connectivity device. Used instead of the |
|
| telemetry event | Sum of trigger time in milliseconds for unsuccessful scans |
|
| telemetry event | Number of unsuccessful scanning/trigger actions |