Activity
The Activity ta provides a comprehensive view of warehouse operations allowing you to track events, analyze process statistics, and identify potential issues. It is an optimization tool that helps you track specific operations and identify unusual patterns, and it is the first screen you see. Its data summaries help allocate resources across different processes and identify which consume the most time and resources. Finally, it offers a record of all issues which, when addressed promptly, can help prevent escalation of operational problems.
Default view, navigation and filters
By default, you will see the Events feed and activities within the last hour. The column directly below lists out recent events chronologically, and the map of your warehouse is displayed in the center of the screen. Click a specific aisle, storage location, bay, level, etc. to select, click and drag to move around the map or use the scroll to zoom in and out of the map. On the right side of the screen is a collapsible Info section which provides more details, depending on what is currently selected.
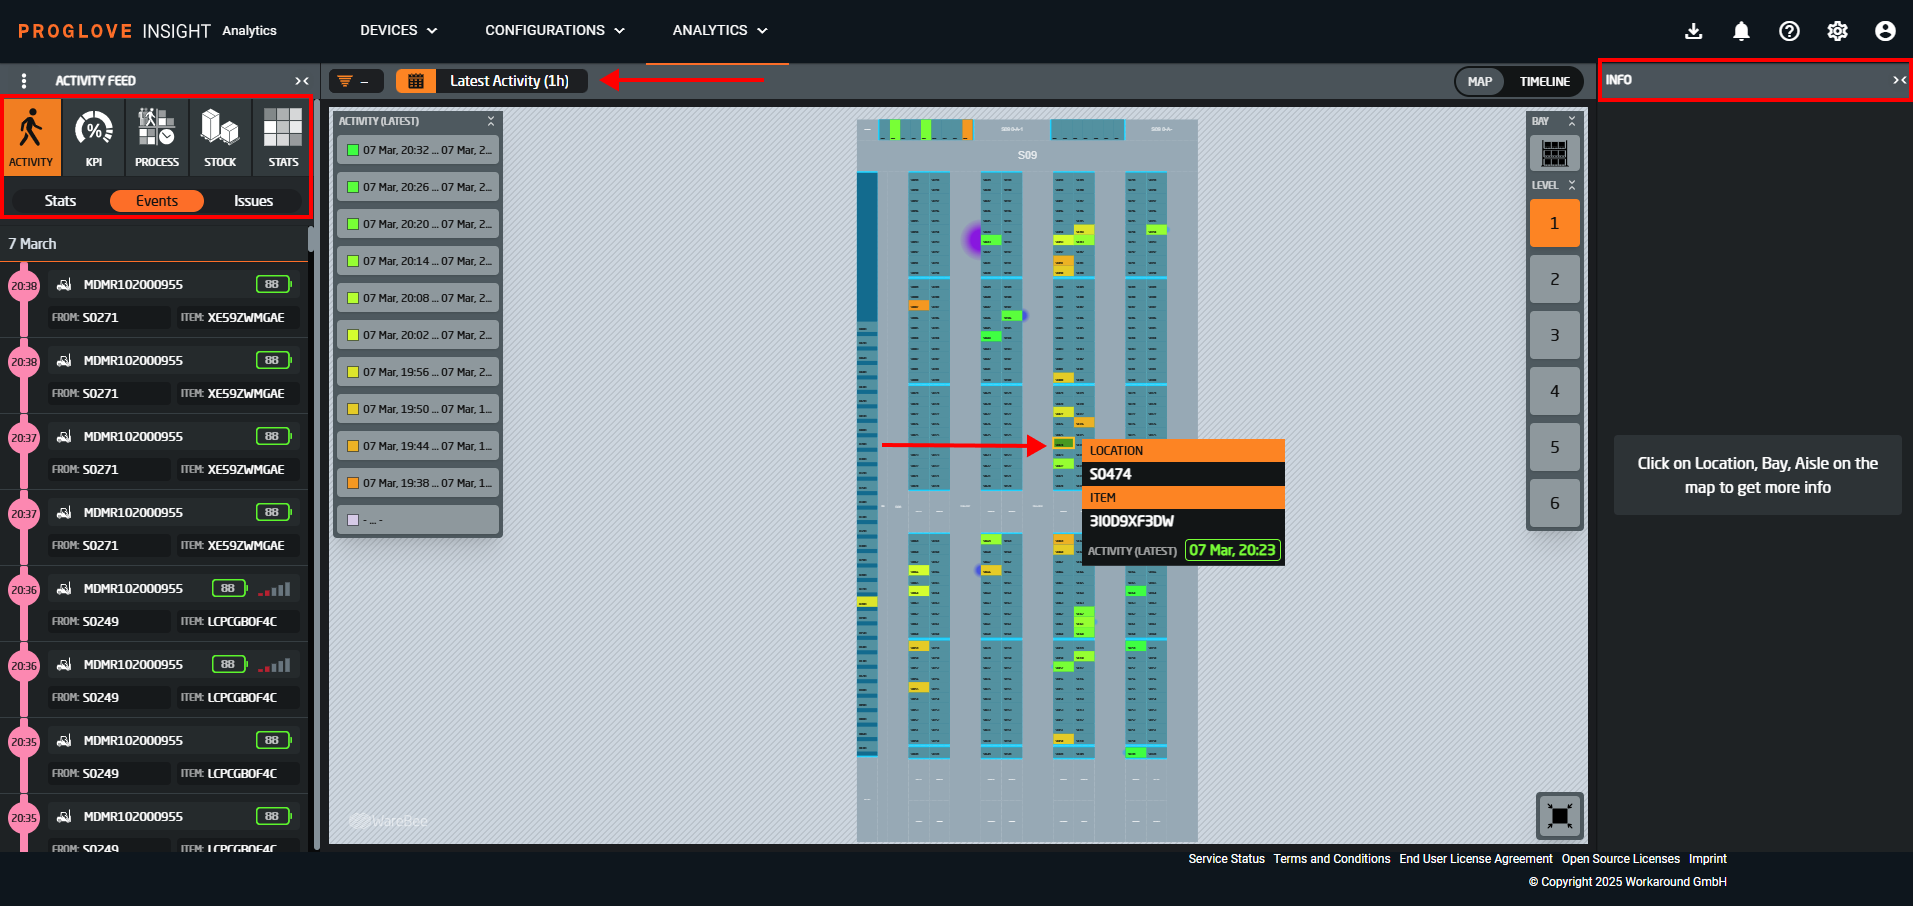
Hovering over any map element provides additional details about it, while clicking it sets the element as a filter and opens its Location info section on the right. Scroll down to see all location properties and related items. In addition, selecting a single shelf displays the whole bay so you can easily switch between adjacent shelves/storage units.
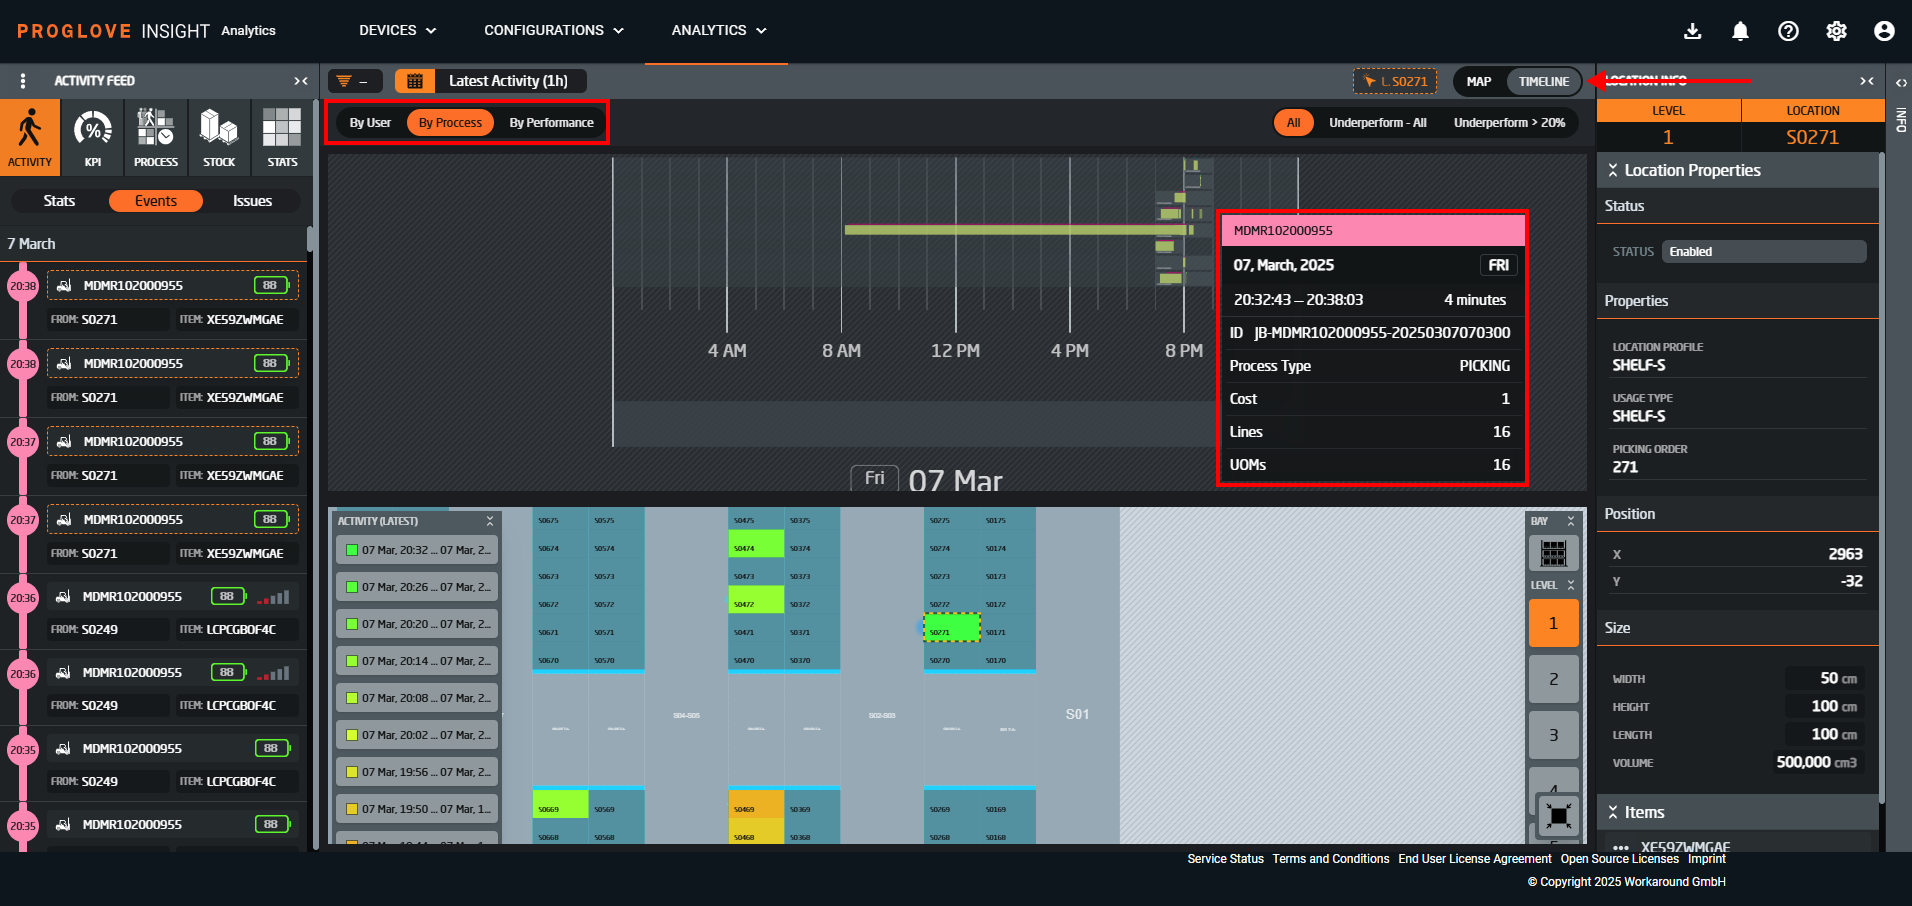
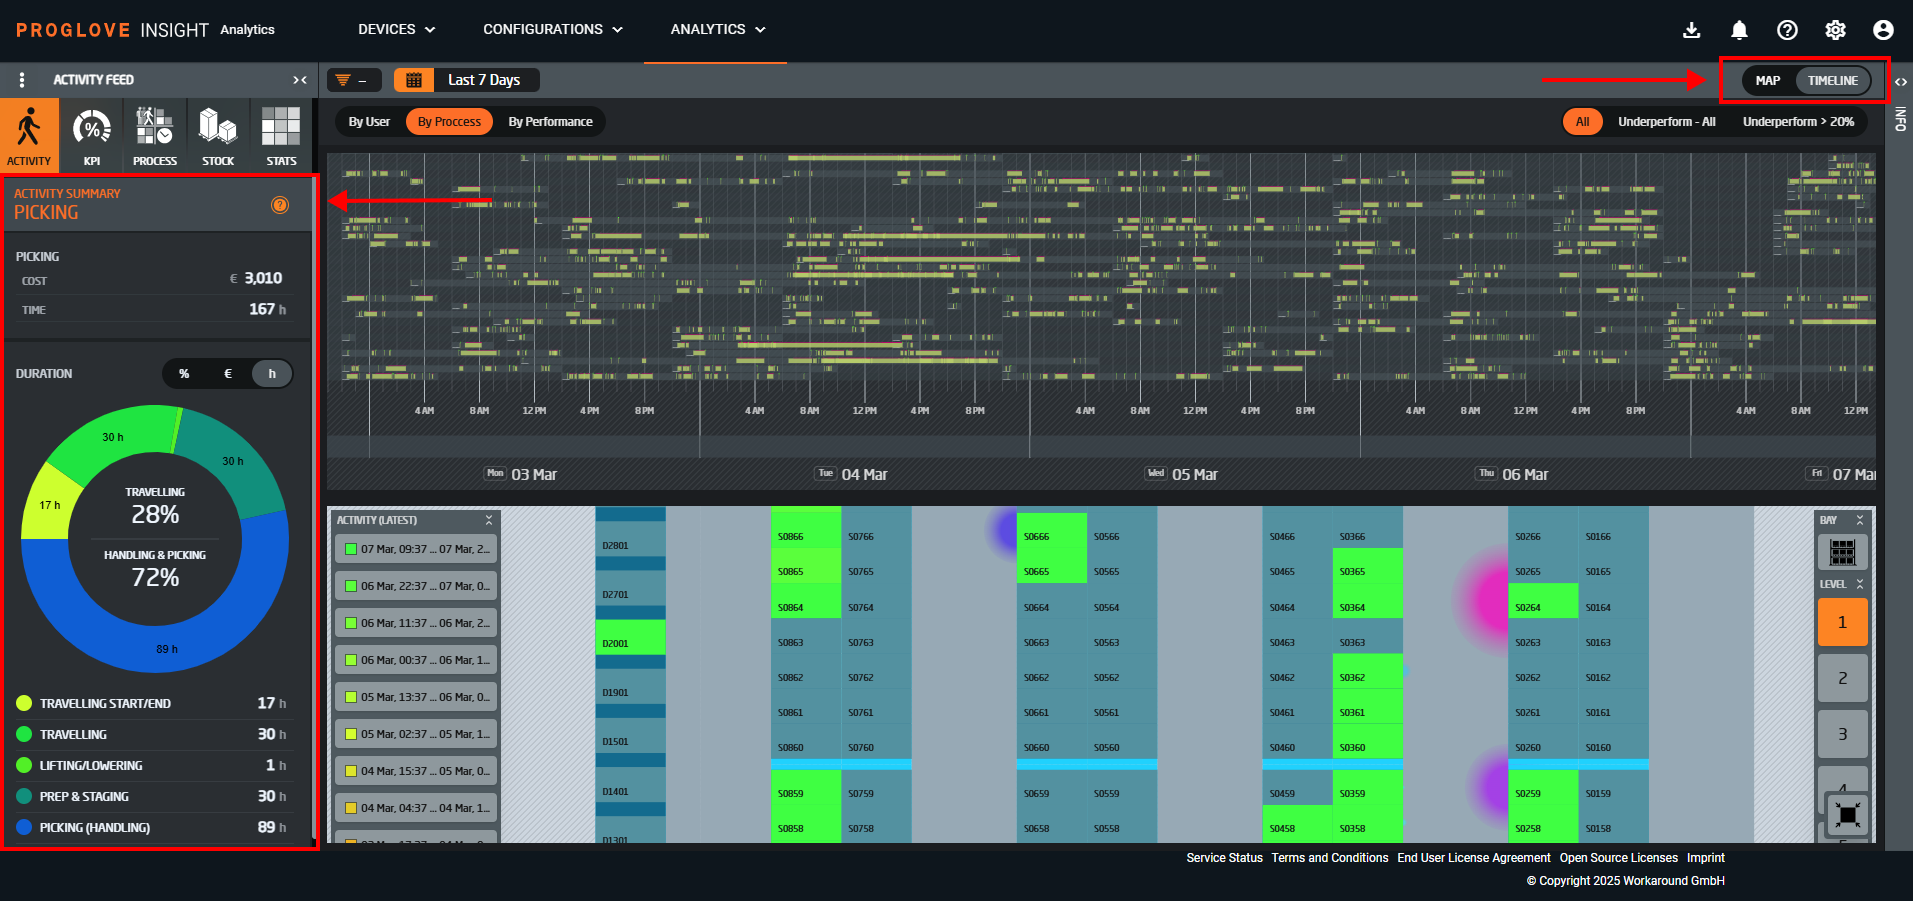
Switching the toggle in the top right-hand corner to the timeline will activate it and split the screen, adding a time breakdown of activities per the defined process. This can be changed to a breakdown by user or by performance. The same as with the map, hovering over any of the timeline elements provides more information, and selecting an event from the timeline will set the event and the user as additional filters.
Events feed
Events activity feed helps you gain valuable insights into your warehouse activities, enabling data-driven decisions to improve efficiency. It displays a chronological record of all warehouse activities, sorted by day and time, and enables you to:
Track all events occurring on your shop floor
View detailed information about each event (location, item, UOM (unit of measure), quantity, device/user, etc.)
Identify patterns in your warehouse operations
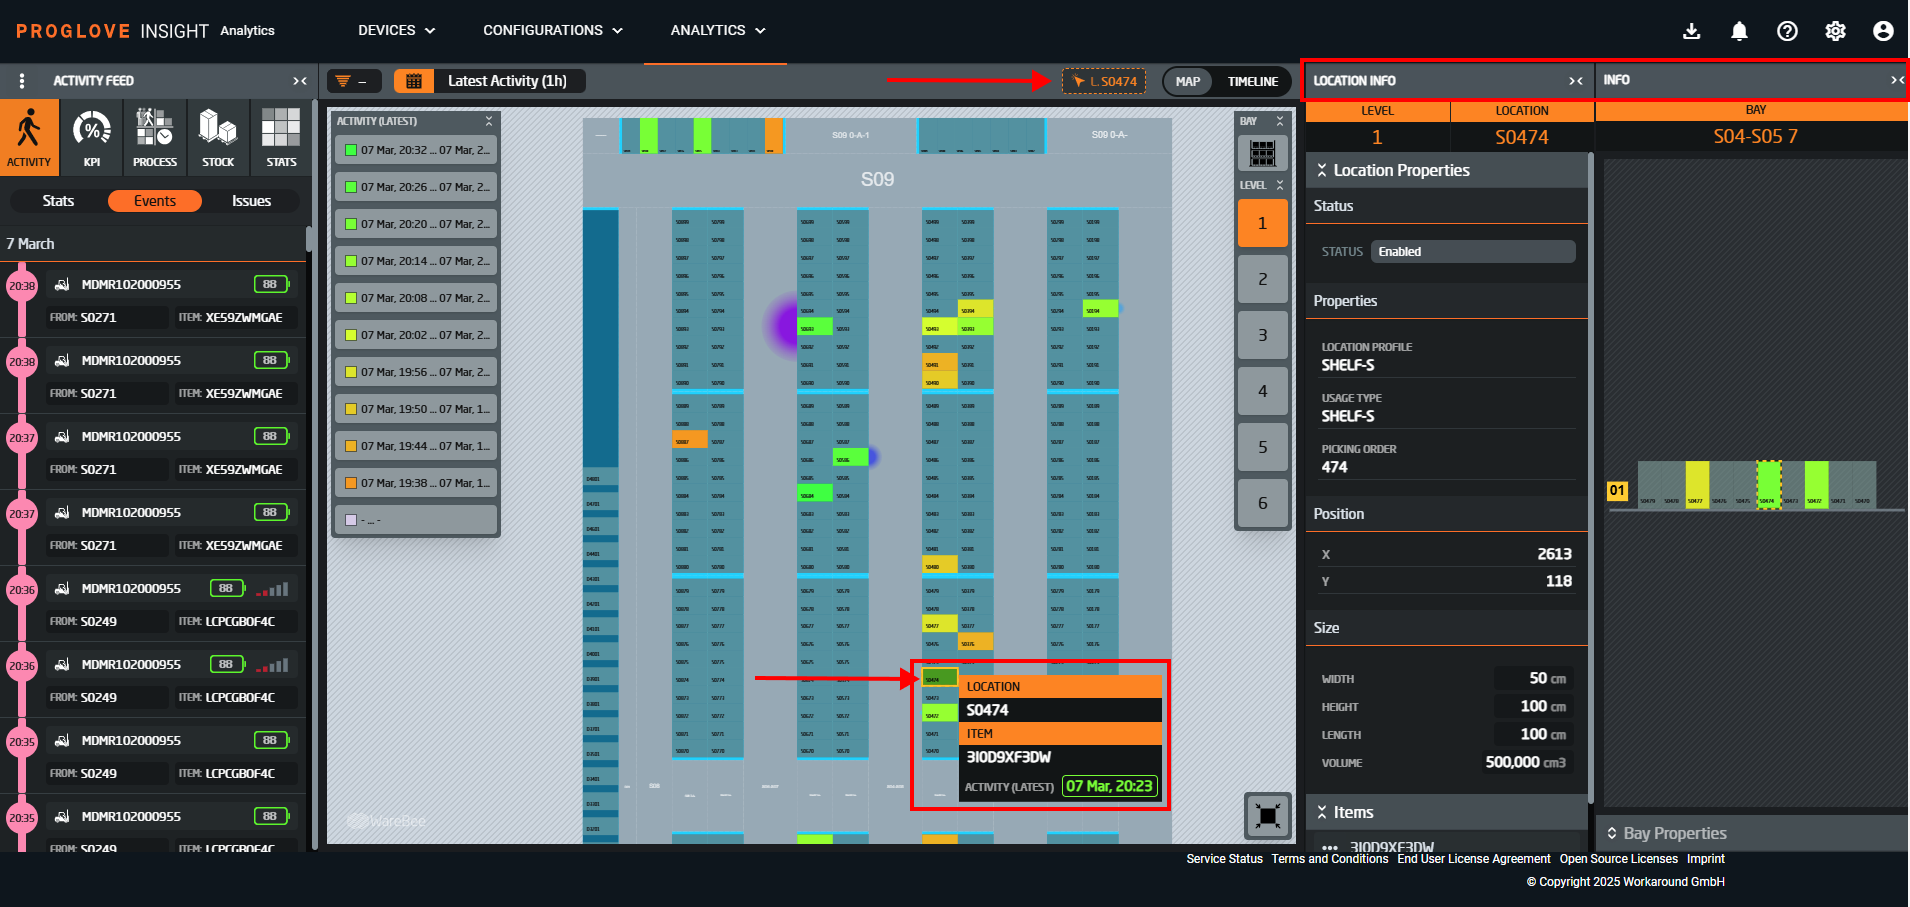
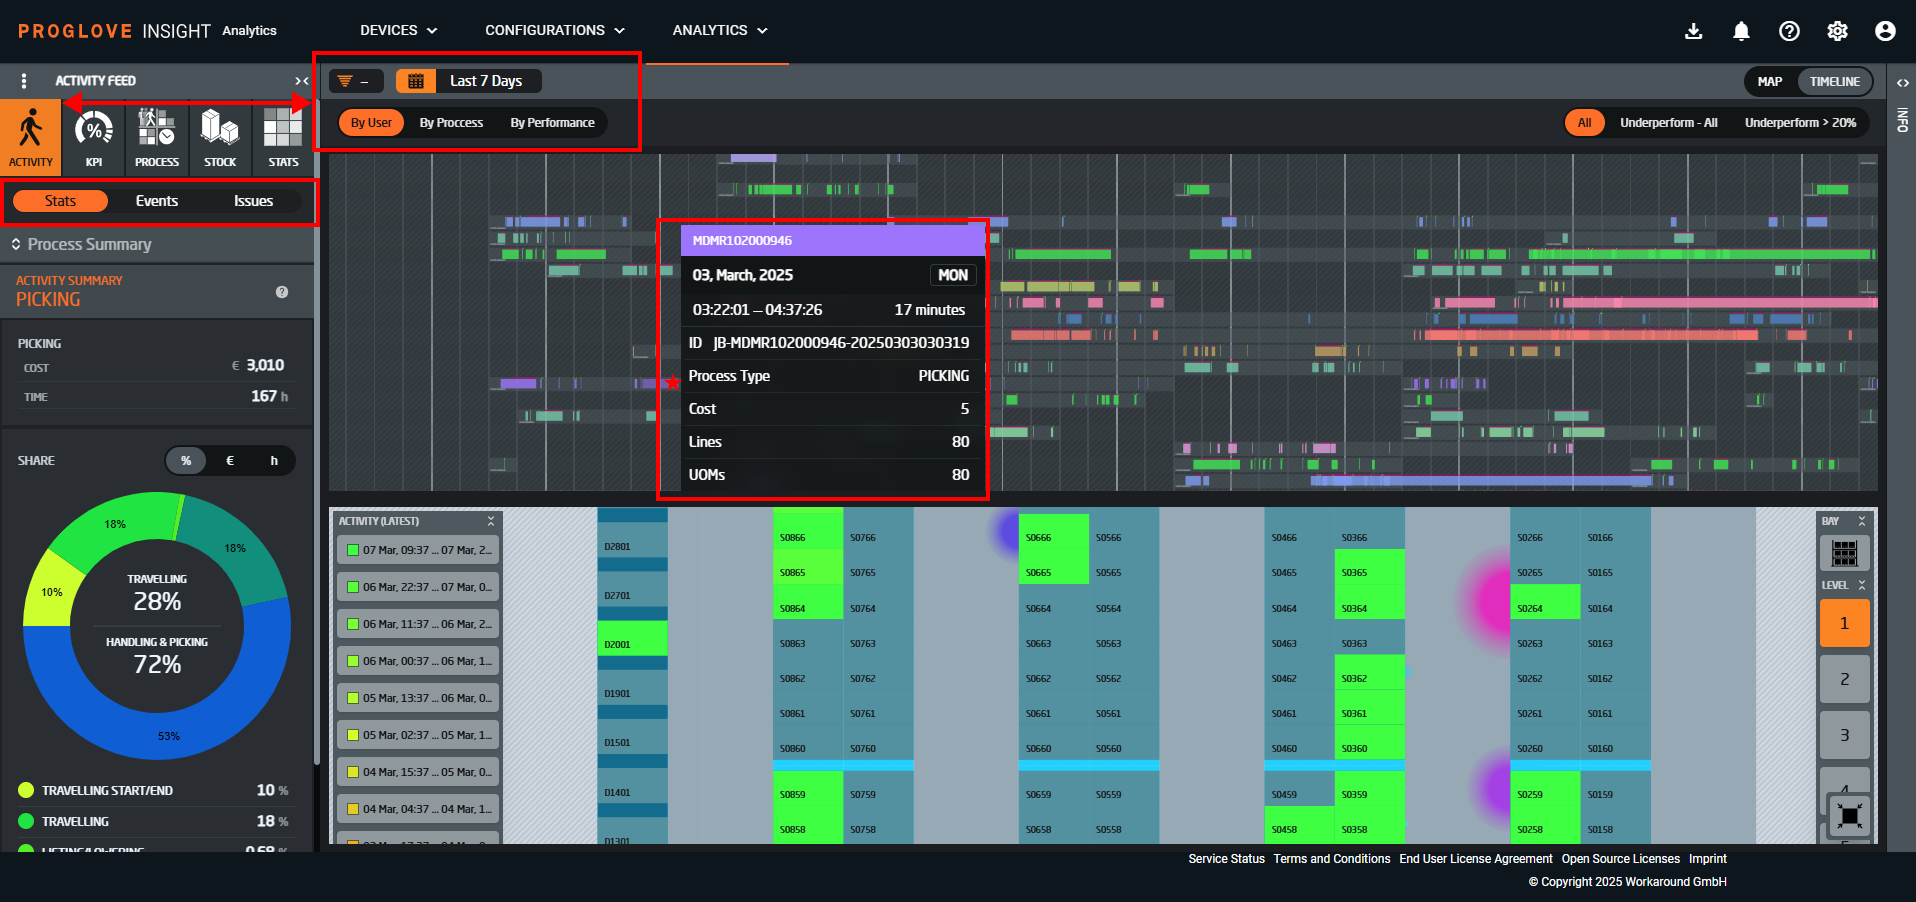
By clicking an event, and depending on what you select (device, location, etc.), filters get applied and additional information appears, detailing the event and its circumstances. Image below shows a location being applied as a filter, hence details of the location and this particular bay are displayed on the right.
Events are color-coded by device/user ID for easier identification, time-based sorting helps track operational sequences. You can use filters to focus on specific events, users or time periods to reveal detailed information and quickly locate relevant activities. Hovering over any displayed info will reveal details about that event, process, device, etc.
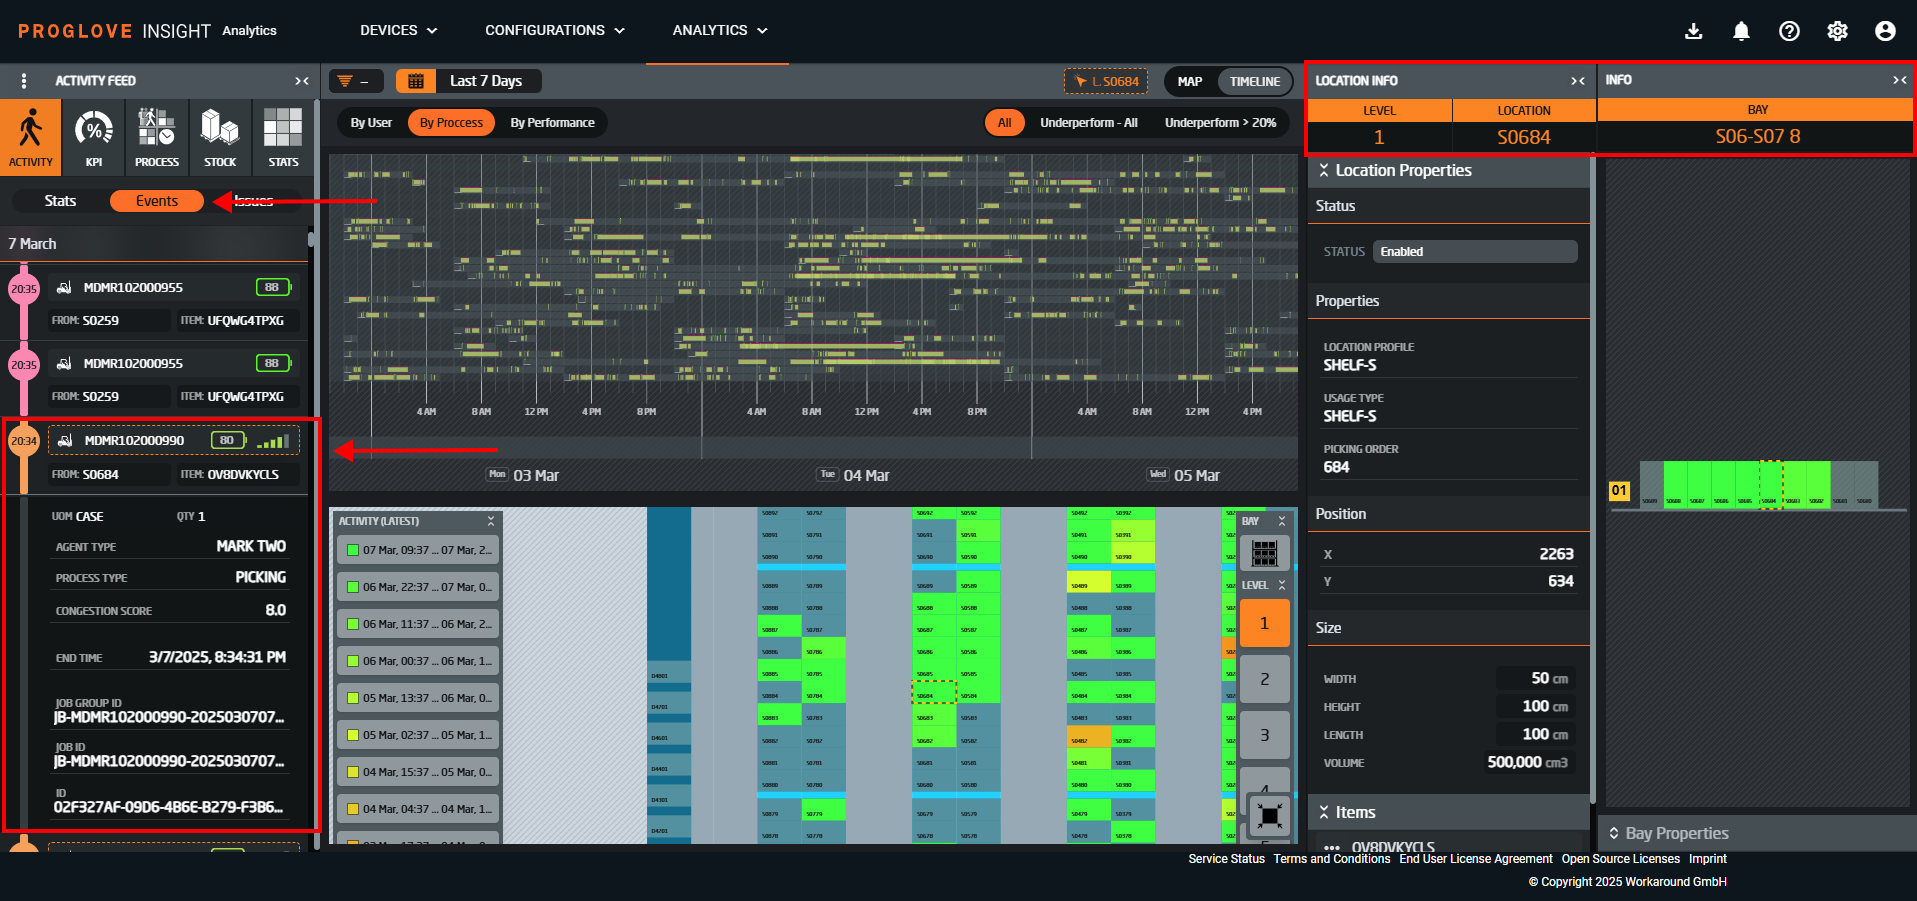
To change the time frame from the default option Latest Activity (1h), click the calendar icon located in the top bar under the main menu, and select a different filter (i.e. Last Shift, Today, Yesterday, Last 7 Days, Last 2 Weeks, This Month, Last Month).
Stats
Stats provide an analytical view of your warehouse processes, broken down into two key components - Process Summary and Activity Summary (by process type).
Process Summary
The Process Summary displays a pie chart visualization of activities by Process Type. This helps you understand the distribution of different processes in your warehouse operations.
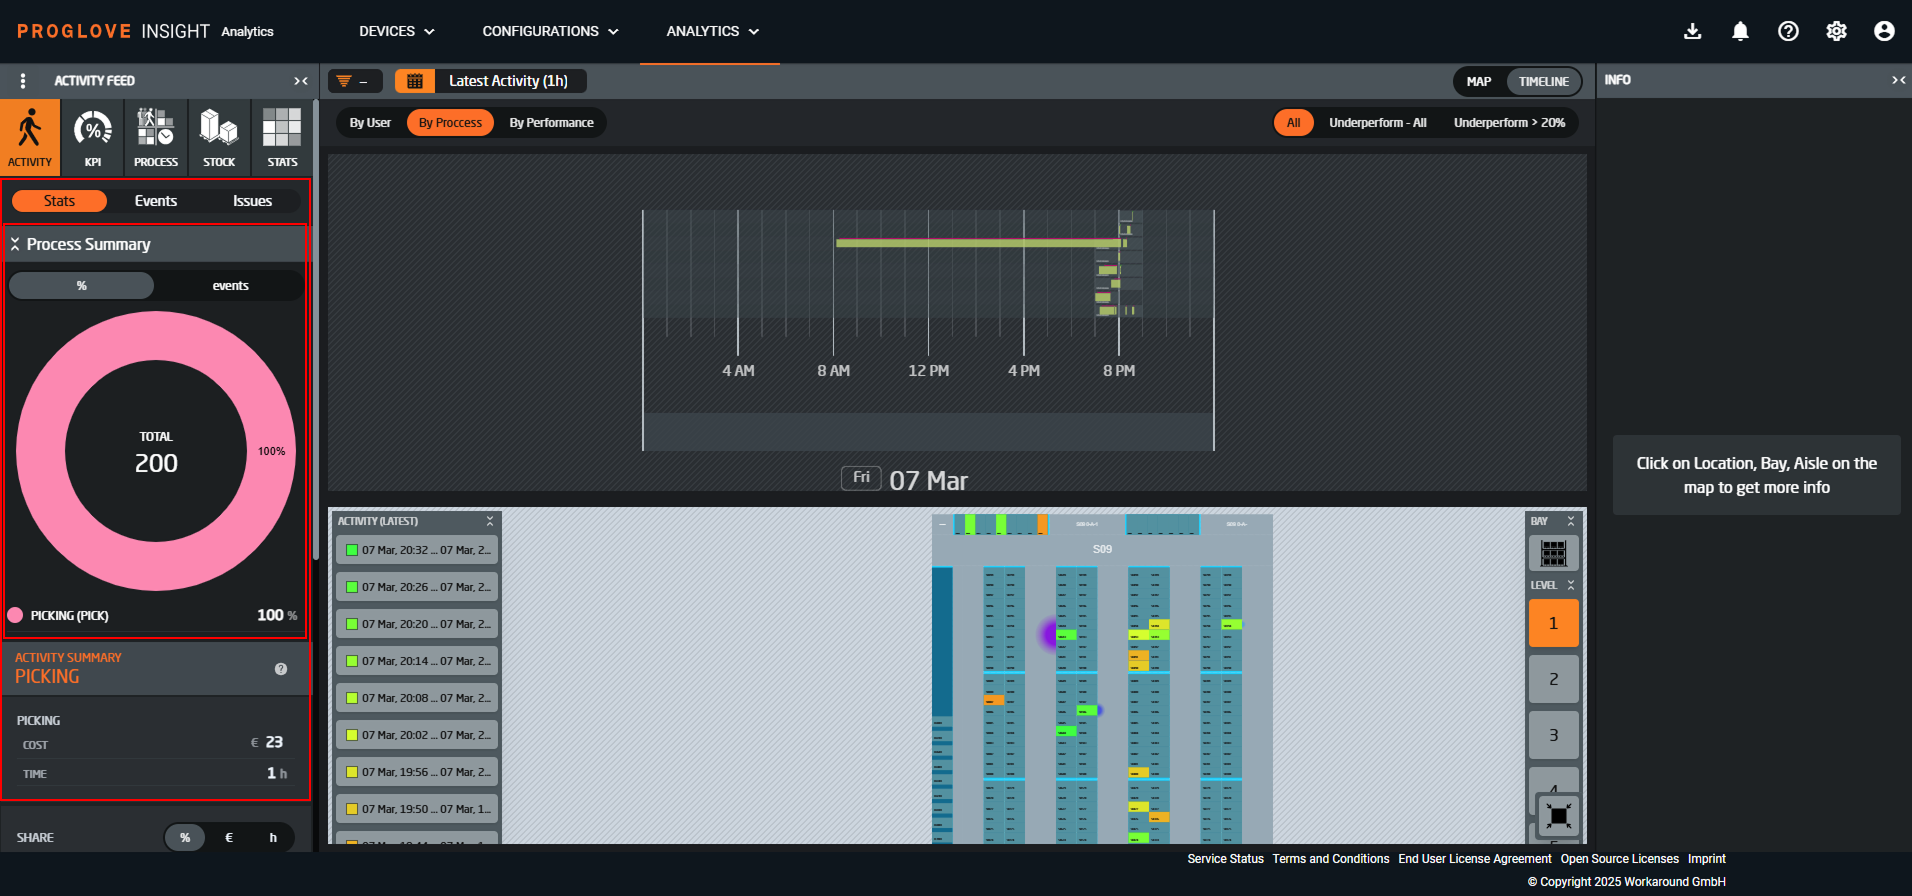
You can toggle the view between two different perspectives:
By Percentage - showing relative distribution of process
By Number of events - showing absolute count of each process type
Activity Summary (by process type)
As you scroll down, you will see the highlights split between activities (travelling, lifting, picking, etc.) and a detailed breakdown of cost and time metrics for each process type (picking, replenishment, etc.), helping you identify where resources are allocated. This is crucial for identifying which parts of your process are most resource-intensive, allowing you to target specific areas of improvement. The data can be presented per percentages (%), cost (€), and duration (h). You can also switch your view from map to a timeline, as needed.
Issues
The Issues section highlights potential problems detected in your warehouse operations based on predefined thresholds and alerts. If this section is empty, it means either no issues have been detected or threshold alerts have not been configured. Review your alert settings to ensure you're capturing relevant issues. When issues are detected, this section will display:
Issue type and severity
Affected processes or areas
Recommended actions