Performance
Note
Performance is a one of ProGlove's customizable analytics features. To enable it in your INSIGHT account, activate the INSIGHT Enhance plan, or apply for a 30-day Free trial.
Get valuable insights into your process and devices, as well as key statistics, relative to any level you select in the defined My Organization hierarchy.
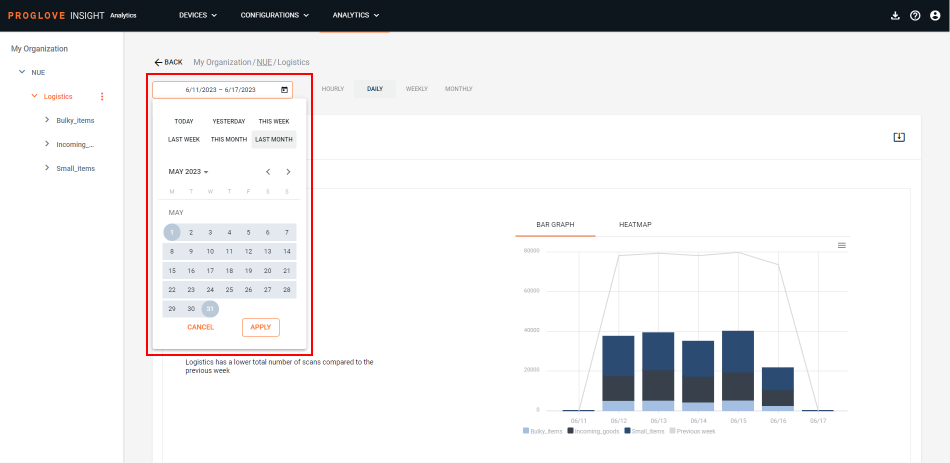
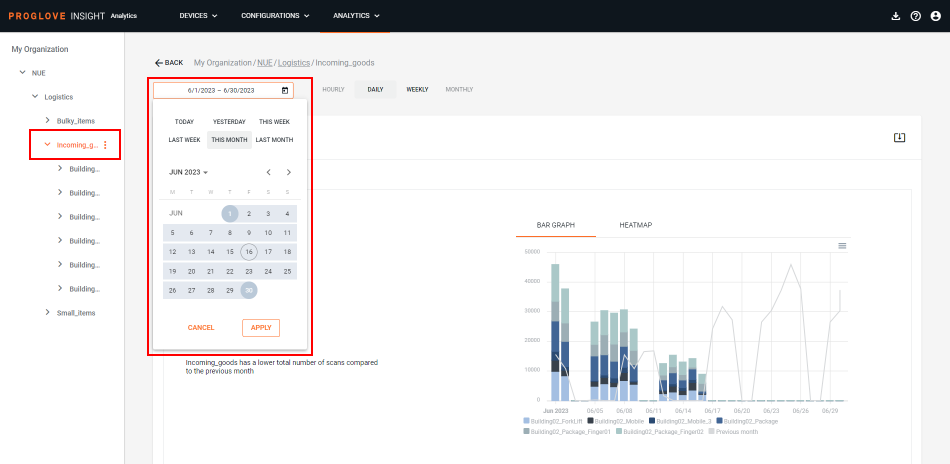
To display the data crucial to your work processes, click the desired level within My Organization and select a time frame. Default selection includes only today's data.
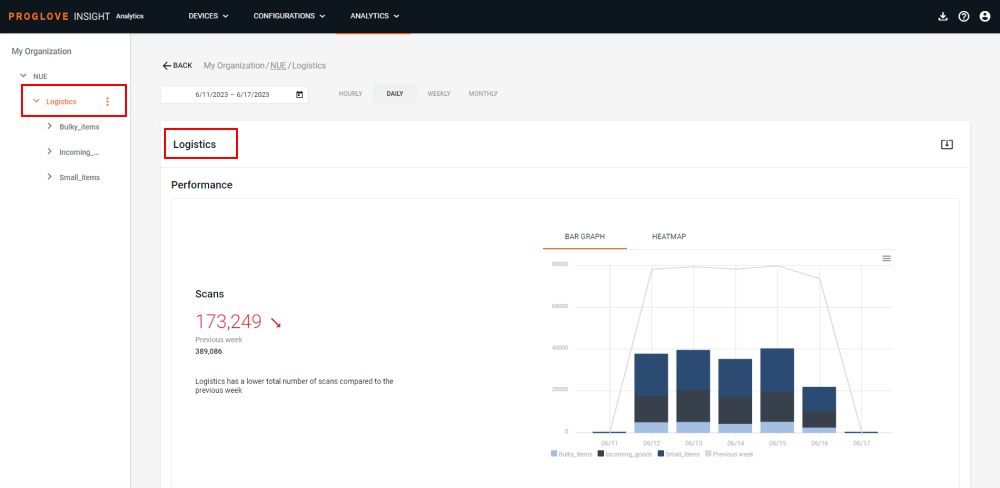
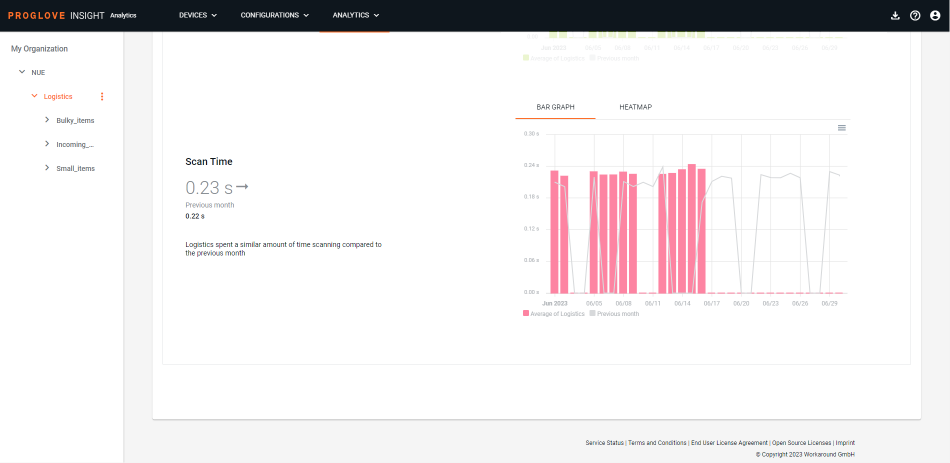
The Performance and Effort sections show Scan, Movement, and Scan Time metrics with the following components:
Graph visualization - Displays the respective measurement over the selected time frame and the selected level within My Organization. Each color in the graph is assigned to one sublevel of the selected level, and its size represents how much it contributed to the overall number. Clicking on different colors in the graph hides or highlights different sublevels. To help you visualize the statistics, you can select to display the data in form of a bar graph or a heatmap.
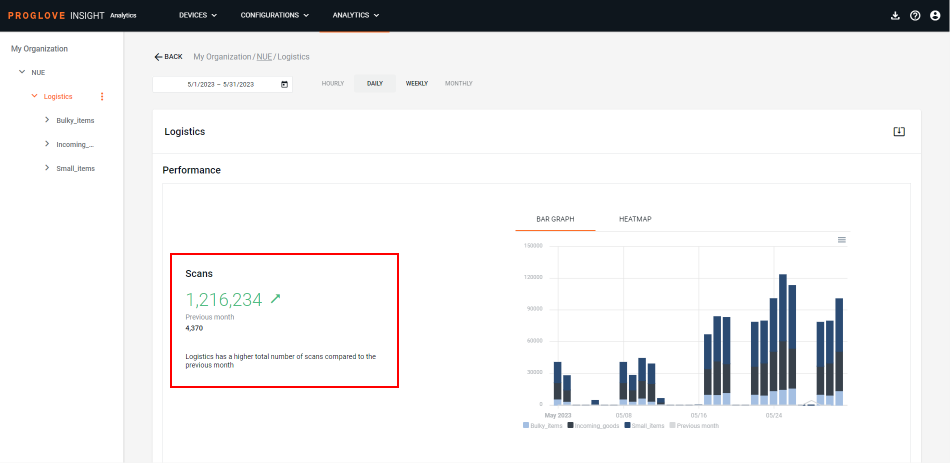
Overall number - The number next to the graph is the accumulated value for the selected time frame and the selected level.
Trend - The green, red, or grey arrow indicate a positive, negative, or neutral trend in comparison to the selected time frame.
Performance
The Performance section displays the number of Scans made under the selected Process Layout level for the selected time frame.
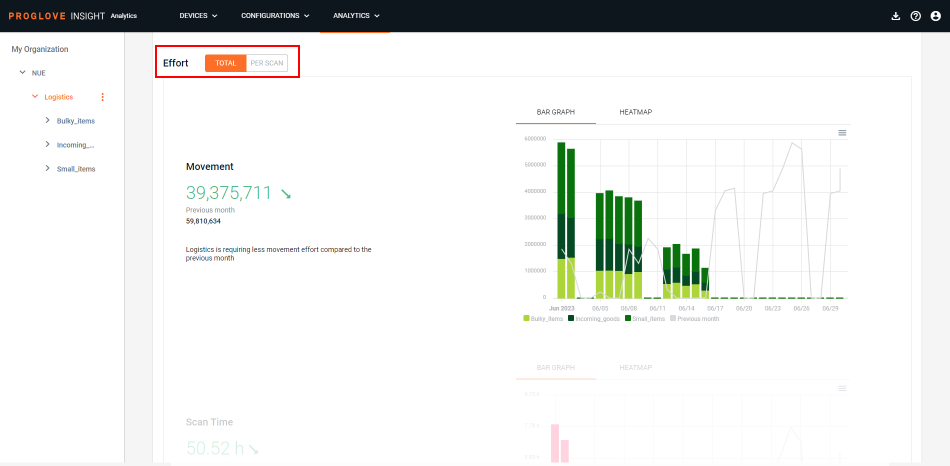
Effort
The Effort section displays the Movement and Scan Time metrics.
The Movement chart helps you visualize the total movement of your workforce under the selected level within My Organization and within the selected time frame. The Movement effort includes the total number of steps (distance walked) by your workforce, as well as any additional effort needed for the process-related movements (e.g. picking and packing).
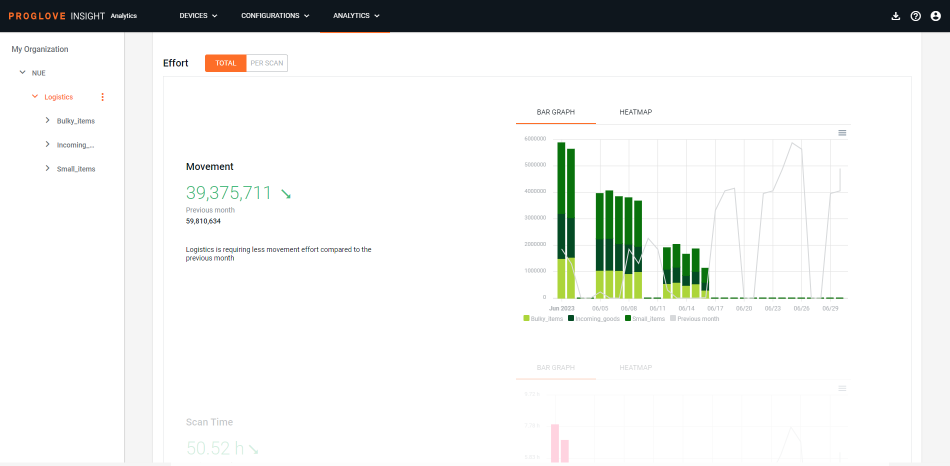
The Scan Time chart displays the overall time of all scanning-related efforts under the selected level within My Organization and within the selected time frame. This includes the time from pressing the scanning button to the decoding of the barcode in case of successful scans, as well as the time spent on all unsuccessful scanning attempts of the same barcode (e.g. in case of damaged barcodes).
Use the toggle at the top of the Effort section to display the Movement and Scan Time statistics for the Total workforce or Per Scan for the selected time frame.
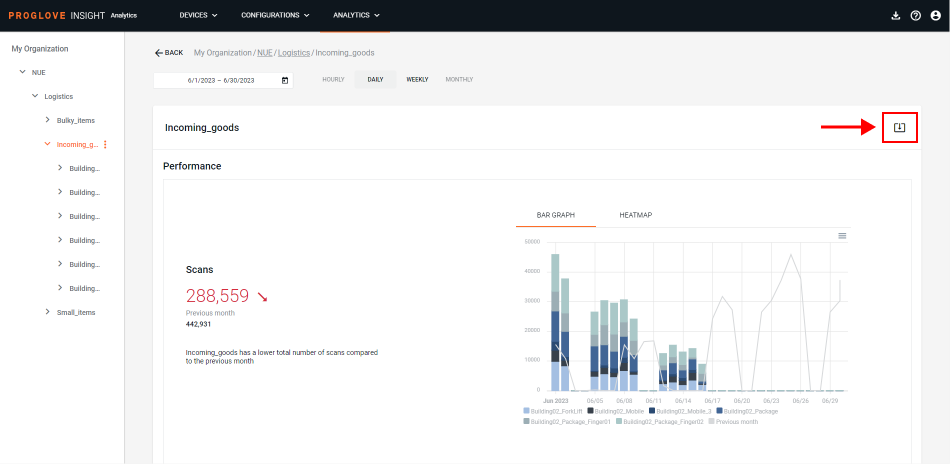
Export data
You can export the data of the current My Organization level selection and time frame in a .csv file.
In the My Organization structure, select a level.
At the top of the page, click on the date picker to open the calendar and select a desired time frame.
Note
The exported
.csvfile can contain up to 30 days of data or up to a million lines/events.Events contain timestamps of the moment they were received by the cloud, while specific metrics (
createdandcreated_time) are based on the connectivity device's system clock, so the two may differ depending on the clock setting. As a result, the exported.csvfile can contain events that have a timestamp outside of the date range that was selected.
In the top right, click the download icon.
The Download Event History modal window displays.
Select DOWNLOAD.
A
.csvfile downloads with the data for the selected parameters.
Note
The export is a semicolon delimited .csv file where the events are displayed in rows while the features are displayed in columns.
Exported data-points
There are four types of events which are used to collect raw data:
Scan events - contain all scanning-related data and metadata
Telemetry events - contain all metadata collected between scans
Display events - contain all metadata collected when scanner receives a display message from connected host
Worker Feedback events - contain all metadata collected when scanner receives an LED feedback from connected host
Introduction events - contain data sent from your Gateway devices every time a connection is established with INSIGHT
Metrics available in the .csv file export
Metric name | Event in which data is collected | Metric data type | Description of metric |
|---|---|---|---|
| Scan and telemetry event | Varchar | Unique ID of the event. |
| Scan and telemetry event | Varchar | Type of event. |
| Scan and telemetry event | Integer | Unix timestamp based on the Connectivity device's system clock. |
| Scan and telemetry event | Varchar | Human-readable timestamp based on the Connectivity device's system clock. |
| Scan event | Varchar | Scanned barcode. |
| Scan event | Varchar | Symbology of the scanned barcode. |
| Scan event | Double | Trigger time in seconds. |
| Scan event | Double | Movement effort of all steps, as well as additional movement, measured by the scanner (e.g. picking, packing efforts). |
| Telemetry event | Double | Sum of trigger time in milliseconds for unsuccessful scans. |
| Telemetry event | Double | Number of unsuccessful scanning/trigger actions. |
| Scan and telemetry event | Varchar | Scanner's serial number. |
| Scan and telemetry event | Double | Scanner’s battery level (in %). |
| Scan and telemetry event | Varchar | Scanner’s firmware version. |
| Scan event | Integer | Scanner's system temperature. |
| Scan and telemetry event | Varchar | Connectivity device's firmware version. |
| Scan and telemetry event | Varchar | Name of the Connectivity device, as defined by the user. |
| Scan and telemetry event | String | Operating system (OS) version of the Connectivity device. |
| Scan and telemetry event | Varchar | Full path of the collecting Connectivity device, with IDs of the parent levels concatenated with a ‘#’ character at the time of ingestion. |
| Scan and telemetry event | Array | Full list of names, defined by the user, of the parent levels for the collecting Connectivity device at the time of ingestion. |
| Scan and telemetry event | Varchar | Thing name of the collecting Connectivity device. Used instead of the |
| Telemetry event | String | Scanner's charging state at the time of ingestion. |
| Telemetry event | Array | A series of events recorded during a specific period of time, while the scanner is charging. |
| Scan and telemetry event | String | ID of the predefined feedback action that was signaled. |
| Display event | String | The display refresh strategy. |
| Display event | String | The ID of the used template. |
| Display event | String | The header text of field 01. |
| Display event | String | The content text of field 01. |
| Display event | String | The header text of field 02. |
| Display event | String | The content text of field 02. |
| Display event | String | The header text of field 03. |
| Display event | String | The content text of field 03. |
| Scan and telemetry event | String | The SSID of the Wi-Fi connection used by the Connectivity device. |
| Scan and telemetry event | String | The BSSID of the Wi-Fi connection used by the Connectivity device. |
| Scan and telemetry event | Integer | The signal strength of the Wi-Fi connection (in dBm). |
| Scan and telemetry event | String | The local IP v4 address of the Wi-Fi connection (if applicable). |
| Scan and telemetry event | String | The IP v4 address of the Wi-Fi access point (if applicable). |
| Scan and telemetry event | Array | The local IP v6 address of the Wi-Fi connection (if applicable). |
| Scan and telemetry event | Array | The IP v6 address of the Wi-Fi access point (if applicable). |
| Scan and telemetry event | String | ID of the currently active session between the Connectivity device and the scanner. With each new connection this value will change. However, it will remain stable across reconnections between cloud/customer integrations. |
| Scan and telemetry event | Integer | Message counter within the current session (see: |
| Telemetry event | String | The Connectivity device's software installation ID (if applicable). |
| Telemetry event | String | The serial number of the Connectivity device. |
| Scan and telemetry event | String | Unique ID of the process the user is working on, i.e. picking or packing. If the user performs the same process consecutively several times, this ID stays the same. To identify individual instances of this process, see: "customer_process_trace_id". |
| Scan and telemetry event | Integer | Timestamp of when a specific process was started. |
| Scan and telemetry event | String | Unique ID of the currently performed execution within a process (see: |
| Scan and telemetry event | Integer | Timestamp when the trace (see: |
| Scan and telemetry event | String | An artificial unique ID to help identify individual users without exactly knowing the person. |
| Scan and telemetry event | Integer | Timestamp of the last change made on the |
| Scan and telemetry event | String | Custom Connectivity device identifier set by the user and used to annotate events. |
Scan performance optimization
Since the below parameters have an influence on the overall scan performance and Scan Time displayed in the Effort section, we advise to check the following and ensure optimal conditions:
Configuration
Check if the scanner settings set in the ProGlove.proconfig file are best suited for the barcodes you are currently scanning. Use Fuzzy 1D processing on 1D, damaged, or low-quality barcodes. For mobile displays, electronic screens, or similarly reflective surfaces, use the Display Mode. In areas of multiple closely-placed barcodes where you want to decode only barcodes below the aiming crosshair (dot) use the Picklist Mode.
Symbology configuration
If your Daily Insights indicates that you are not using a certain symbology, consider turning it off in your configuration file to speed up the decoding. Having fewer symbologies enabled takes less time to scan and decode the desired barcodes.
Physical barcode condition
You scanning performance is greatly affected in cases of dirty, damaged, or even reflective barcodes. Check the state of your barcodes to identify possible improvements to the scan reliability and speed, and either preserve the physical barcode quality or try enabling the Fuzzy 1D processing in your configuration's Scanner settings. If you find the barcode surface too reflective (e.g. scanned from a display), or the barcode too large or small to scan, consider adjusting the scanning distance or the light conditions or enabling the Display Mode in the Scanner settings of your configuration.
Worker handling
The way in which workers scan using ProGlove scanners can also have an influence on the scan time. Make sure to provide your workers with enough time and training with the devices.
Dirty scanner camera lens
Your scanning performance can be affected by a dirty camera lens on your scanner. If your scanners are used in industrial environments with heightened dust conditions, make sure to clean the scanners regularly as demonstrated here.
Symbology usage
The table below presents the list of most used symbologies and how fast they are decoded (Scan Time) as compared to the ProGlove benchmark (established by processing data from multiple customers' use cases).
Symbology | Average decode time (in seconds) |
|---|---|
CODE 39 | 0.23 |
ITF | 0.25 |
CODE 128 | 0.25 |
EAN-8 | 0.27 |
UPCA | 0.32 |
EAN-13 | 0.32 |
GS1-128 | 0.34 |
QR CODE | 0.35 |
DATA MATRIX | 0.37 |
CODE 11 | 0.45 |
IATA | 0.50 |
D25 | 0.50 |