Working with Narratives
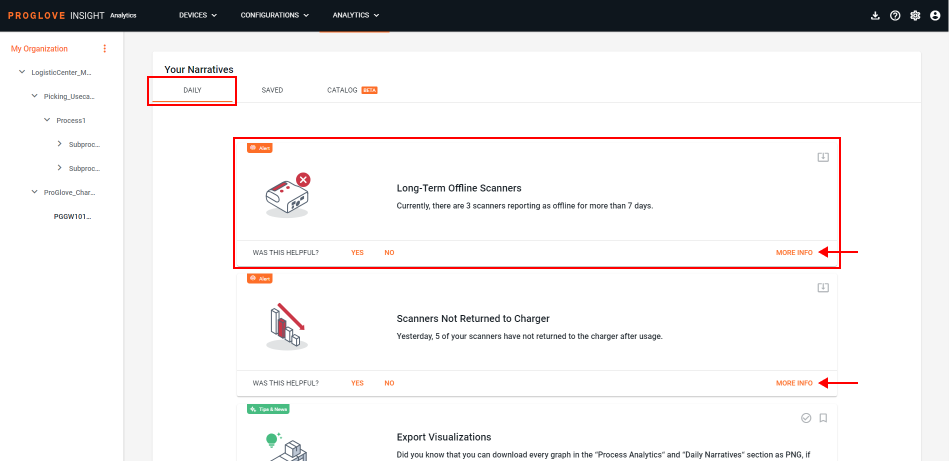
Unless you have previously selected Saved Narratives to be your default view, Daily Narratives will be the first thing you see when logging on to INSIGHT. Clicking the ProGlove logo in the upper-left corner of the INSIGHT UI also takes you directly to the Daily Narratives tab.
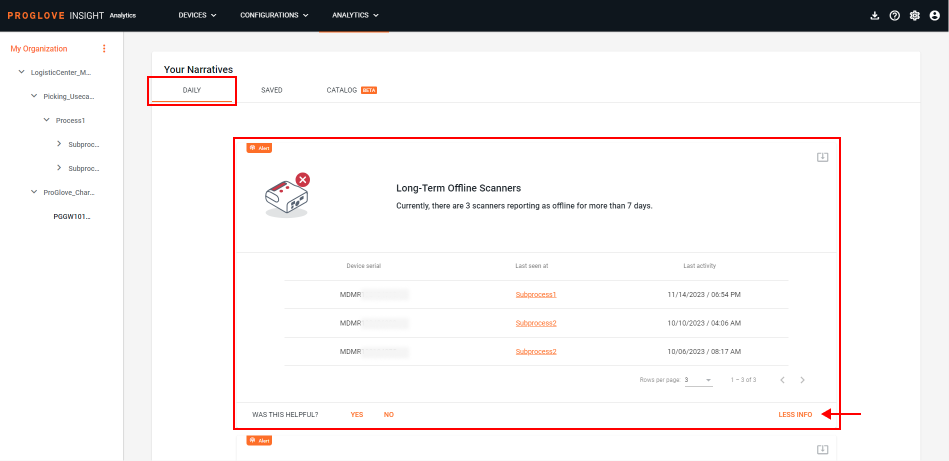
Alerts are always on top and remain highlighted until you open them by clicking the MORE INFO button, where there are additional details on what exactly triggered the alert and requires attention. If a specific alert gets triggered multiple times throughout the day, note that only the numbers/data will change, while the displayed message remains the same. Once you're done reviewing the details, click LESS INFO to close the card.
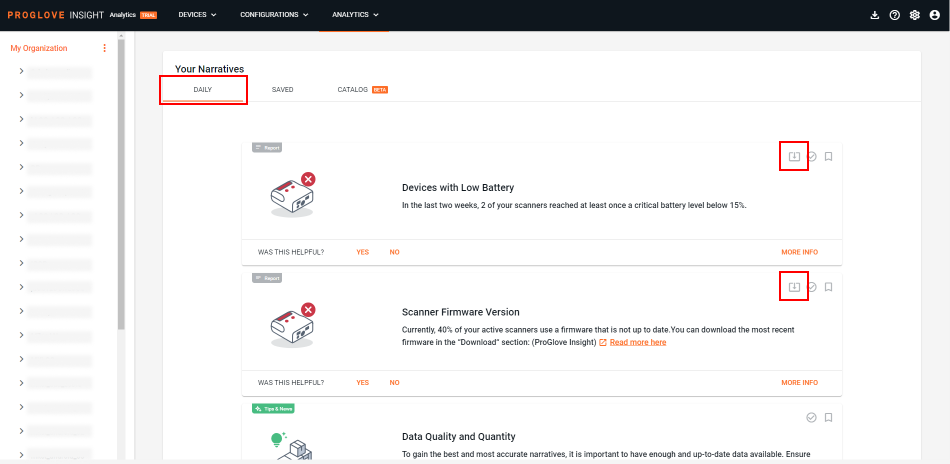
Download some or all generated reports, from both Daily and Saved Narratives, in order to archive them and analyze them at a later time, or even work offline. Select the download icon above each report and download the data in a .csv file.
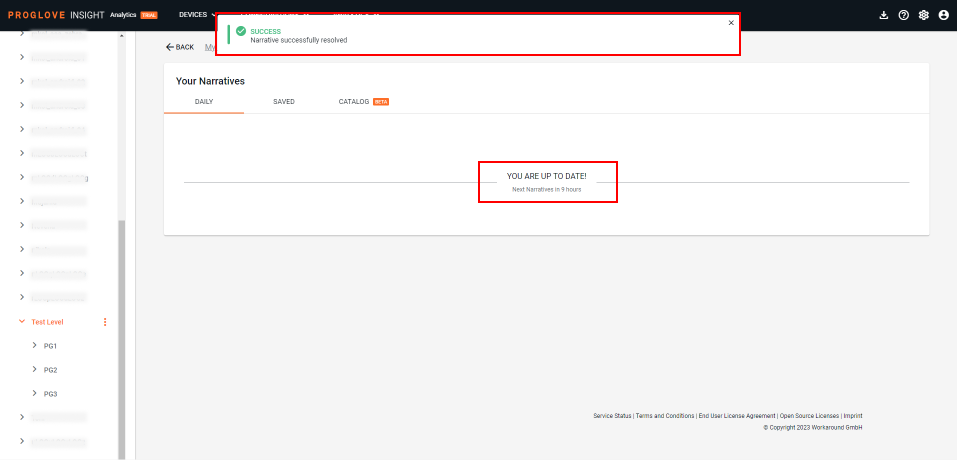
Once you review your daily reports, you can mark each one as Solved using the checkmark in the upper-right corner and they will disappear from the list.
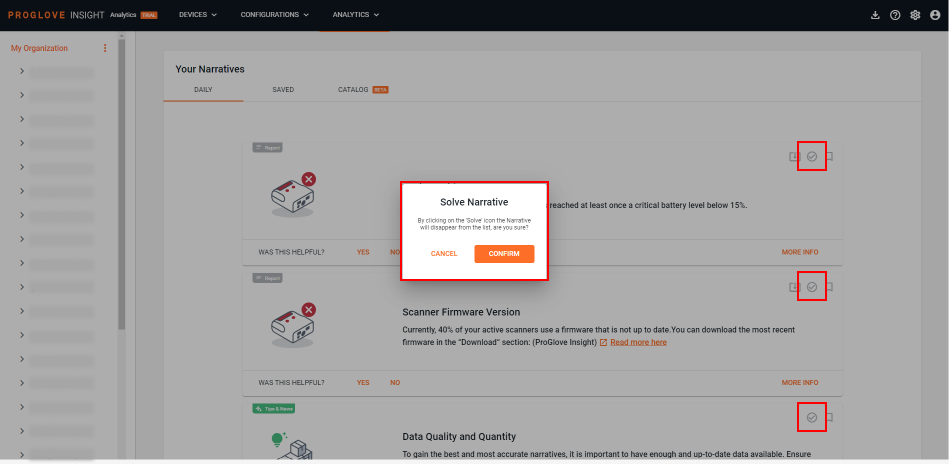
In case all reports were solved, you will see the message:
Important
The available data depends on the connected devices and usage. Reference the table below for specific requirements.
Table of alerts
There are multiple alerts available in INSIGHT. Reference the table below for the title, description, duration and requirements that enable the creation of each alert.
Title | Category | Description | Minimum requirements | Alert duration |
|---|---|---|---|---|
Scanners moved between locations | Lost & Found | Displays the total number and details of scanners that were moved between organizational levels with different Geo locations. | INSIGHT Control subscription plan and Geo locations defined at all levels. | Visible for 24 hours after the scanner was moved. |
Scanners sending inactive signals | Lost & Found | Displays the total number and details of scanners that are not in active use or charging, but are currently transmitting inactive signals. | INSIGHT Control subscription plan and inactive signals turned on in Device configurations. | Visible until all inactive scanners are returned to charger, paired with a Connectivity Device or have stopped sending signals entirely (scanner is out of range or has shut down). |
Open photo reports created by workforce | Process Performance | Displays the number and details of new photo reports captured by your workforce, and provides information about the devices and levels from which they were reported. | INSIGHT Enhance subscription plan and Photo Reporting enabled on the account. | Visible until all new photo reports are resolved (status changed from Open to Resolved) or deleted. |
Scanners with low battery in active use | Process Performance | Displays the total number and details of all scanners that are currently being used but have critically low battery levels. | INSIGHT Enhance subscription plan and at least one scanner in use with battery level of 15% and below. | Visible until there is at least one active scanner with battery level of 15% and below. |
Scanners offline for more than 7 days | Lost & Found | Displays the total number and the details of each scanner that has not been used for more than 7 days. | INSIGHT Control subscription plan and at least one scanner that is in an offline status for more than 7 days. | Visible until all scanners, that were offline for more than 7 days, are either returned to charger or paired with a Connectivity Device. |
Table of reports
There are over 20 reports available in INSIGHT. Below is a list that shows the title, description, and any subscription plan or device requirements that enable the creation of each one.
Title | Category | Description | Subscription/device |
|---|---|---|---|
Average Scan Duration | Scan Performance | Shows the average time needed for a scan and how it performs over time. See also: Scan performance optimization. | INSIGHT Enhance |
Busiest Time of Day | Process Performance | Analyzes the number of scans during the whole day and identifies an hour with the highest number of scans. Information of the busiest hour of the day is displayed next to a bar chart with the total number of daily scans. | INSIGHT Enhance |
Busiest Week Day | Process Performance | Analyzes the number of scans during the whole week and identifies a day with the highest number of scans. Information of the busiest day of the week is displayed next to a bar chart with the total number of weekly scans. | INSIGHT Enhance |
Charging Behavior | Device Visibility | Provides an overview of the charging behavior on your shop floor. It displays the occurrences of not charging scanners between shifts in the last 14 days. | INSIGHT Enhance |
Daily Record | Process Performance | The report appears when a scanner in your hierarchy level achieves a record in the number of scans in one single day, compared to its entire scanning history. | INSIGHT Enhance |
Devices with Low Battery | Process Performance | Display details about devices that have reached a low battery battery level. A battery level is identified as low if it is less than 15%. | INSIGHT Control, INSIGHT Enhance |
Device Usage without Pause | Worker Ergonomics | Displays the number of devices used for more than 8 consecutive hours during with minimal or no breaks. | INSIGHT Enhance |
Failed Barcode Scans | Scan Performance | Displays the number of failed scan attempts and details on the symbology, time spent, etc. | INSIGHT Enhance |
Fastest Barcode Symbology | Scan Performance | Displays the barcode symbology with the fastest recognition considering scan time. See also: Scan performance optimization. | INSIGHT Enhance |
Gateway Application Firmware Version | Device Visibility | Displays a list of Gateway devices that do not have the latest firmware version. | INSIGHT Control, INSIGHT Enhance, Gateway |
Hourly Workload per Scanner | Process Performance | Shows the average number of scans per hour for the previous day. | INSIGHT Enhance |
Insight Mobile Version | Device Visibility | Shows you a list of Android devices that do not have the latest INSIGHT Mobile version. | INSIGHT Control, INSIGHT Enhance, INSIGHT Mobile (Android) app |
Most scanned Barcode Symbology | Scan Performance | Displays the symbology that was scanned the most compared to other symbologies in your process. | INSIGHT Enhance |
Movement Effort | Worker Ergonomics | Displays the average movement effort over the last 2 weeks, with additional details also showing the movement effort for each day. Read more about Effort. | INSIGHT Enhance |
Not configured devices | Device Visibility | Displays the number of devices that were actively scanning in the last two weeks without a configuration applied. | INSIGHT Enhance |
Rarely used scanner | Lost & Found | Displays device usage details, such as the number of days used in last month and last activity, related to scanners that were rarely used in the last month. | INSIGHT Control, INSIGHT Enhance |
Restricting Barcode Symbologies | Scan Performance | Indicates the amount of time that can be saved by disabling potentially irrelevant barcode symbologies. Read more about Symbology settings. | INSIGHT Enhance |
Scanner Firmware Version | Device Visibility | Displays a list of scanners that do not have the latest firmware version. | INSIGHT Control, INSIGHT Enhance |
Scanner Record | Process Performance | The report appears when a scanner reaches the highest number of scans on a single day, compared to the scanning history recorded by all scanners connected to the same INSIGHT account. | INSIGHT Enhance |
Scan Performance comparison last month | Scan Performance | Compares the total number of performed scans to the number of scans recorded on the same day last month to check if there is an increase or decrease. | INSIGHT Enhance |
Scan Time Saving Potential | Scan Performance | Provides an estimate of the time and cost saving potentials based on the the scan time data from the last 30 days. See also: Scan performance optimization. | INSIGHT Enhance |
Slowest Barcode Symbology | Scan Performance | Displays the symbology with the slowest scan recognition compared to other symbologies in your process. | INSIGHT Enhance |
Unsuccessful Scans Ratio | Scan Performance | Shows the ration between successful and unsuccessful scans recordwithin the last 14 days. See also: Scan performance optimization. | INSIGHT Enhance |
User Benchmark Comparison | Scan Performance | Compares your average scan time in the last 14 days with the ProGlove benchmark average. See also: Scan performance optimization. | INSIGHT Enhance |
FAQs
- 1. What is the main difference between alerts and reports?
- 2. The numbers I see in Narratives for My Organization and individual levels don't add up. What could be wrong?
- 3. Can I download all Narratives?
1. | What is the main difference between alerts and reports? |
While reports are created daily, based on the data collected within the last 24 hours, alerts can be triggered by events all throughout the day in almost real-time. | |
2. | The numbers I see in Narratives for My Organization and individual levels don't add up. What could be wrong? |
Most likely nothing is wrong. This topic always requires a bit of data analysis and context, as some Narratives contain complex conditions that may not be met on all levels. For example: Device X shows up in a Narrative for the whole organization as a scanner that made more than 100 scans. It has made exactly 101 scans, out of which 99 scans were done in Level1, and 2 scans in Level2. Hence, Device X will not be displayed in the same Narrative for any of the levels (or sublevels), but is displayed for the main, My Organization structure. | |
3. | Can I download all Narratives? |
You can download all reports that have the MORE INFO button. These contain tables with additional details, specific values and device information. Other reports are in the form of concise and actionable messages and can not be downloaded. Learn more here. |