KPI
The KPI (key performance indicator) tab provides detailed performance metrics for your warehouse operations, allowing you to monitor productivity, efficiency, and resource utilization at both summary and individual levels. This analysis helps you identify training opportunities and recognize high performers, while the net vs. gross metrics help distinguish between actual working time (net) and total time including breaks and downtime (gross).
Performance overview displays critical warehouse KPIs in a consolidated dashboard format, while the resource-based analysis allows for an in-depth analysis of performance by individual resources (pickers/operators). As in the Activity feed, hovering over elements will provide more details while clicking any of the resources automatically applies it as a filter.
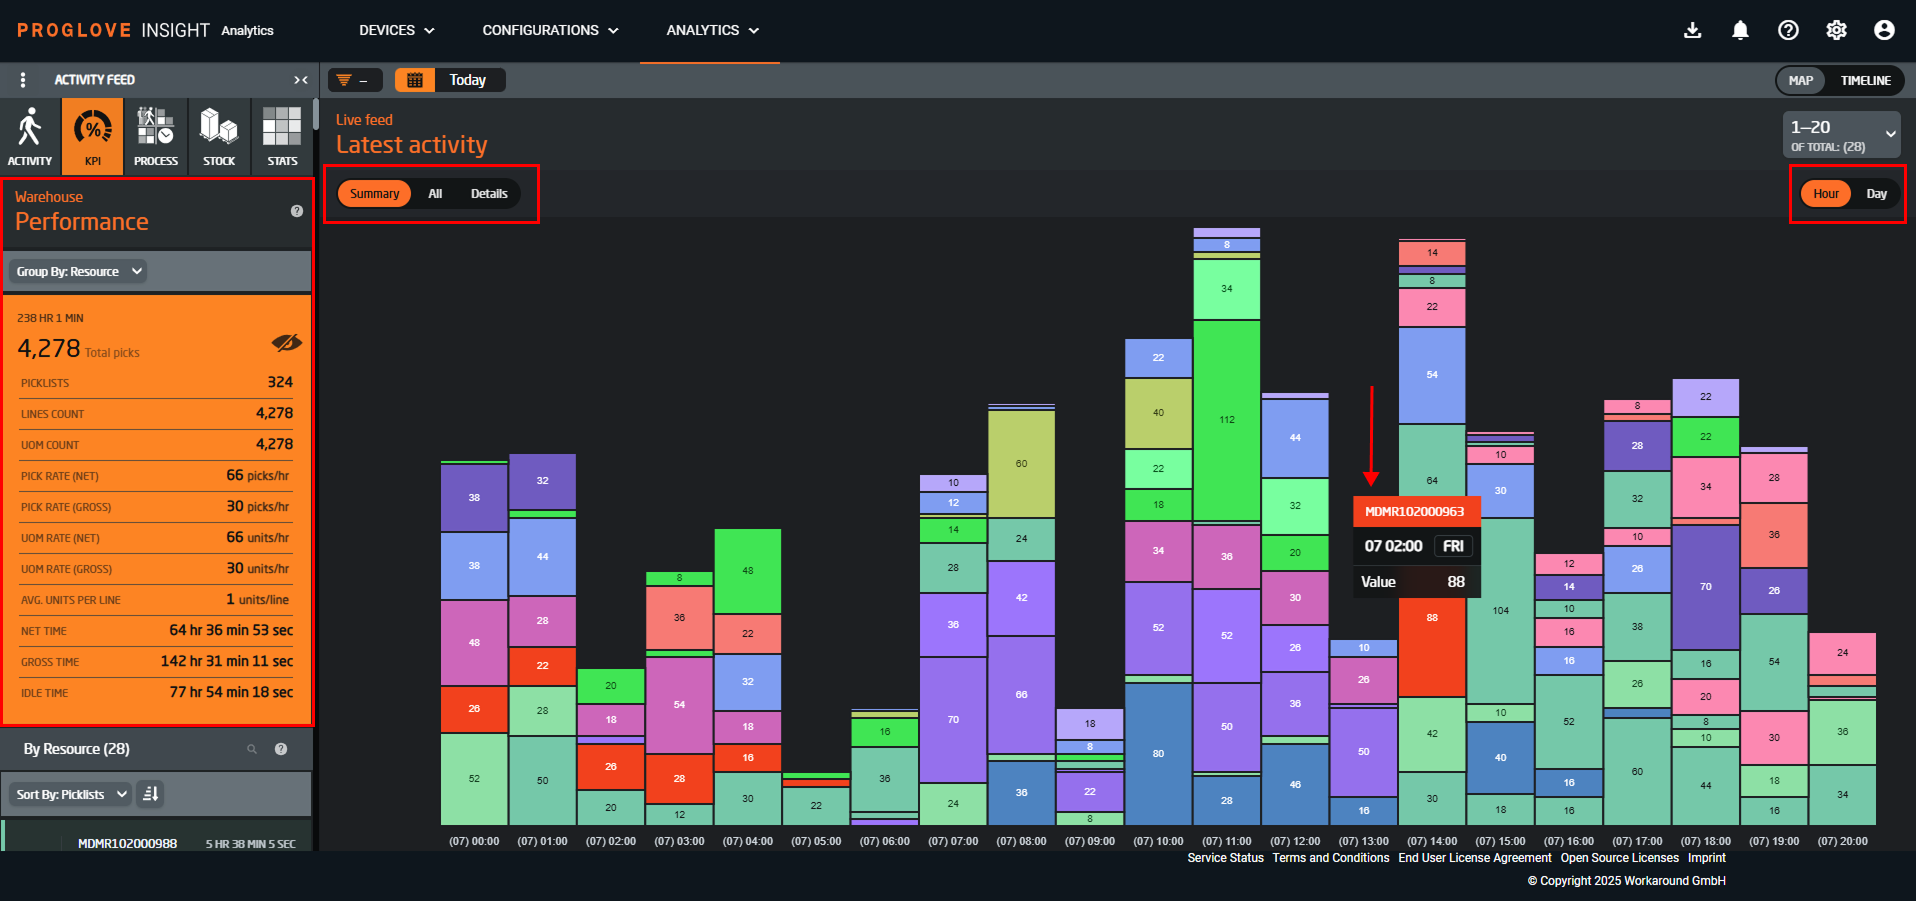
Apart from the heatmap view shown in the image above, the KPI tab offers another powerful time-based visualization option for the latest activities (within the last hour). See an example of the timeline view below, along with the view descriptions.
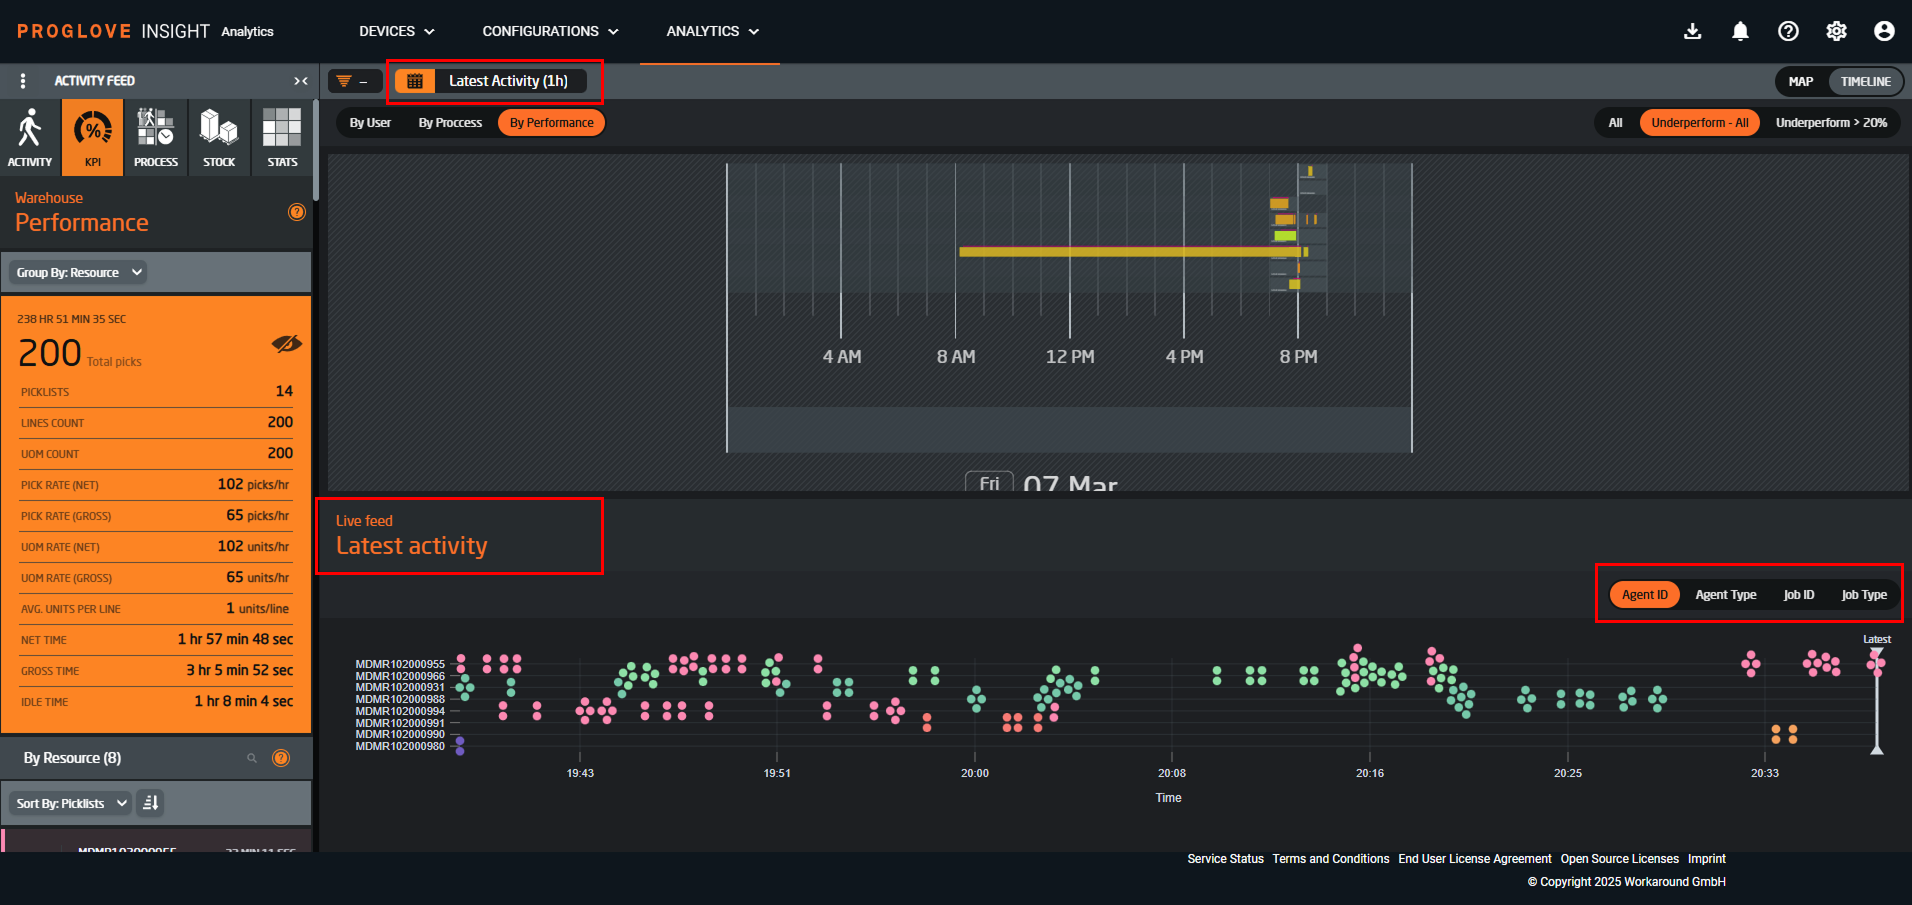
Timeline view | Heatmap view |
|---|---|
|
|
Group by resource to see team-level metrics, review individual resources, compare resources side-by-side to identify top performers, and sort by various metrics. See below for a table of key metrics and their definitions.
Metric name | Definition |
|---|---|
Total Picks | The overall number of picking activities completed. |
Picklists | Number of picking lists processed. |
Lines Count | Total number of order lines handled. |
UOM Count | Total units of measure picked. |
Pick Rates | Both net and gross picking speeds (picks/hour). |
UOM Rates | Both net and gross unit picking speeds (units/hour). |
Average Units Per Line | Efficiency metric showing units per order line. |
Time Metrics | Breakdown of net, gross, and idle time. |
Optimize with KPI data
Regular KPI monitoring is essential for continuous improvement. Look for trends over time rather than focusing only on single-day metrics.
The KPI tab empowers data-driven decisions by helping to:
identify productivity patterns to optimize staffing schedules
benchmark performance across different resources or teams
set realistic targets based on historical performance data
monitor the impact of process changes or training initiatives
identify underperforming resources who may need additional support and training
See below for more performance metrics, their definitions and category.
Metric name | Measure | Definition | Category |
|---|---|---|---|
Picklist | count | Total number of picklists generated, indicating workload and planning efficiency. | Order picking efficiency |
Lines Count | lines | Count of individual item lines picked, measuring volume of operations. | |
UOM Count | units | Number of items processed in their respective unit of measure (i.e. cases per hour), reflecting the operational scope. | |
Pick Rate (Net) | lines/hour | Average number of lines picked per hour, excluding idle time, for productivity assessment. | Picking rates |
Pick Rate (Gross) | lines/hour | Total number of lines picked per hour, offering a broad operational efficiency view. | |
UOM Rate (Net) | units/hour | Units picked per hour, net of downtime, highlighting focused productivity. | |
UOM Rate (Gross) | units/hour | Gross rate of units picked per hour, for overall throughput evaluation. | |
Net Time | hours | Active work hours minus breaks and idle time, showing effective operational engagement. | Time management |
Gross Time | hours | Total work duration including all activities for overall time assessment. | |
Idle Time | hours | Time not spent on direct activities, pinpointing efficiency improvement opportunities. Calculated by Gross Time minus Net Time, where Gross Time is the total time unless a shift has been selected. | |
Energy Indicator | percentage | Battery life of devices, crucial for seamless operations. | Device telemetry |
Signal Strength | dBm (decibel milliwatts) | Wi-Fi connectivity quality of devices, ensuring reliable data transmission. |