Process
The Process tab provides detailed insights into your warehouse operations at a process level, enabling you to analyze workflows, identify bottlenecks, and optimize resource utilization. This tool combines event tracking, performance metrics, and issue identification to give you complete visibility into your labor processes.
With a quick overview of the latest activities and processes organized hierarchically for easy navigation, and resource cards that provide at-a-glance performance summaries, you will be able to quickly identify patterns and optimization opportunities. Color coding helps understand performance variations and potential issue, and there's a time, distance and cost metric associated for each user process.
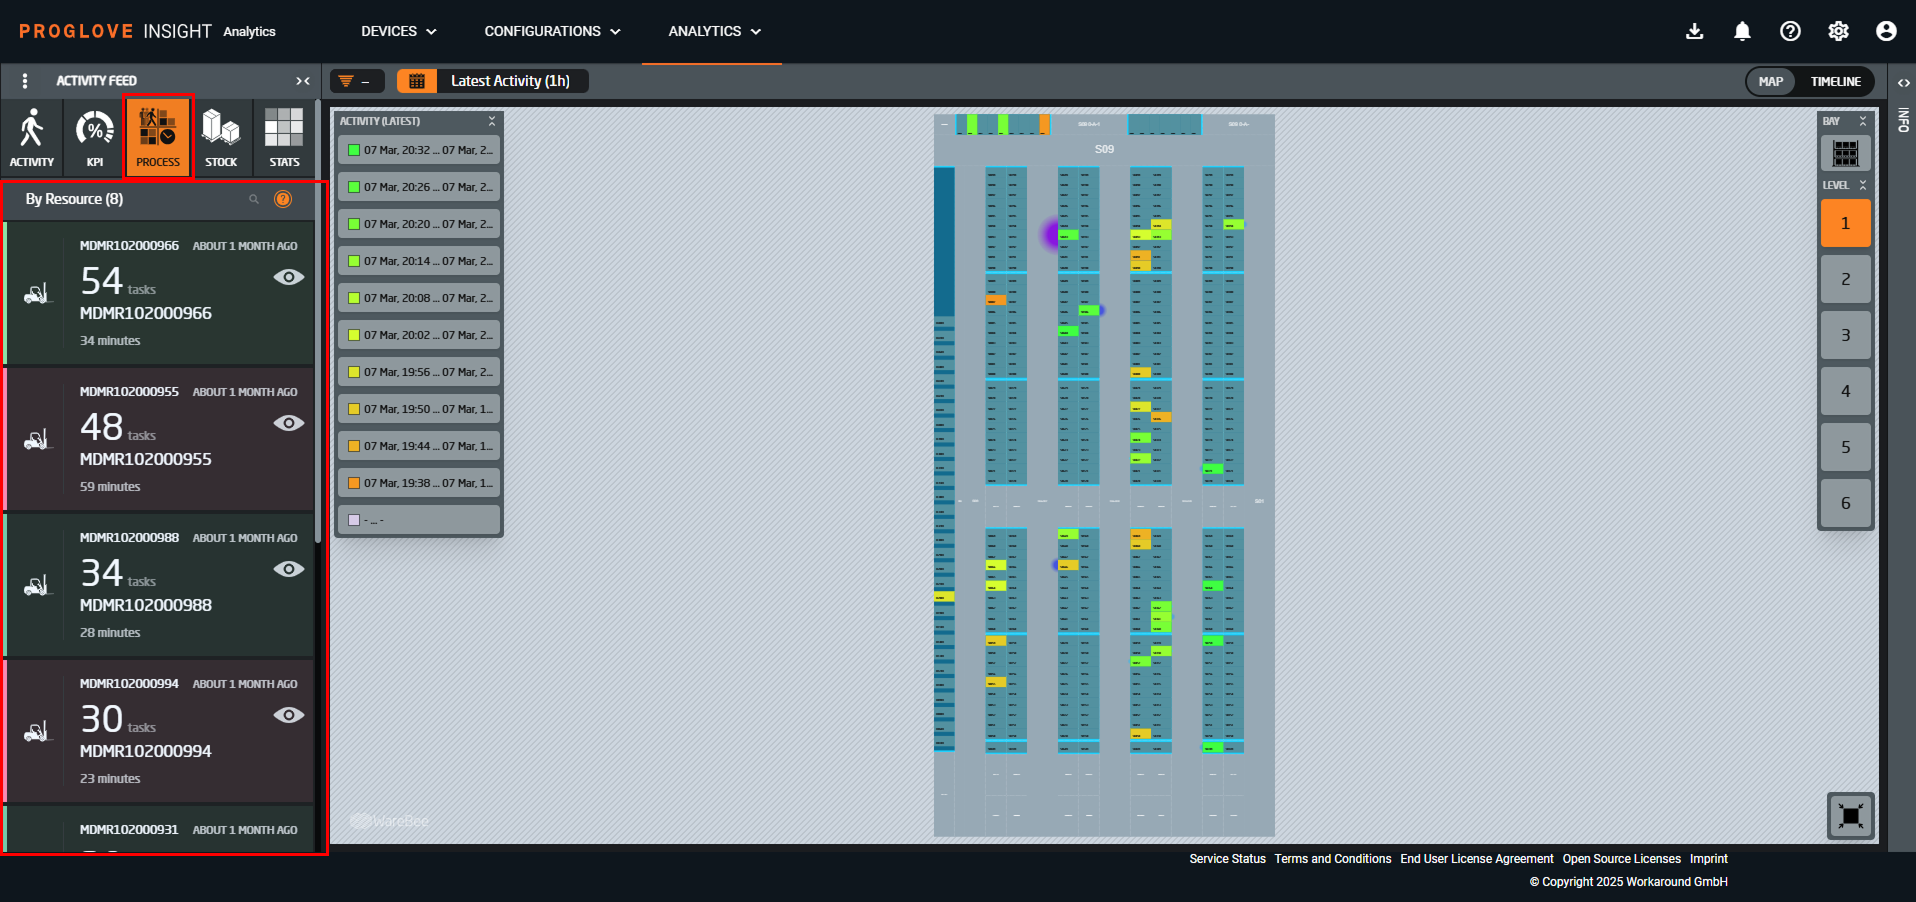
Score cards for each resource (user/device) are hierarchically listed by default. You can instantly identify the resource, when and for how long it was last active, as well as the total number of tasks they completed. Selecting (clicking) any of the resources will open its Activity Events column displaying the latest activities recorded from that resource. Toggle between Events, Stats and Issues to review the details.
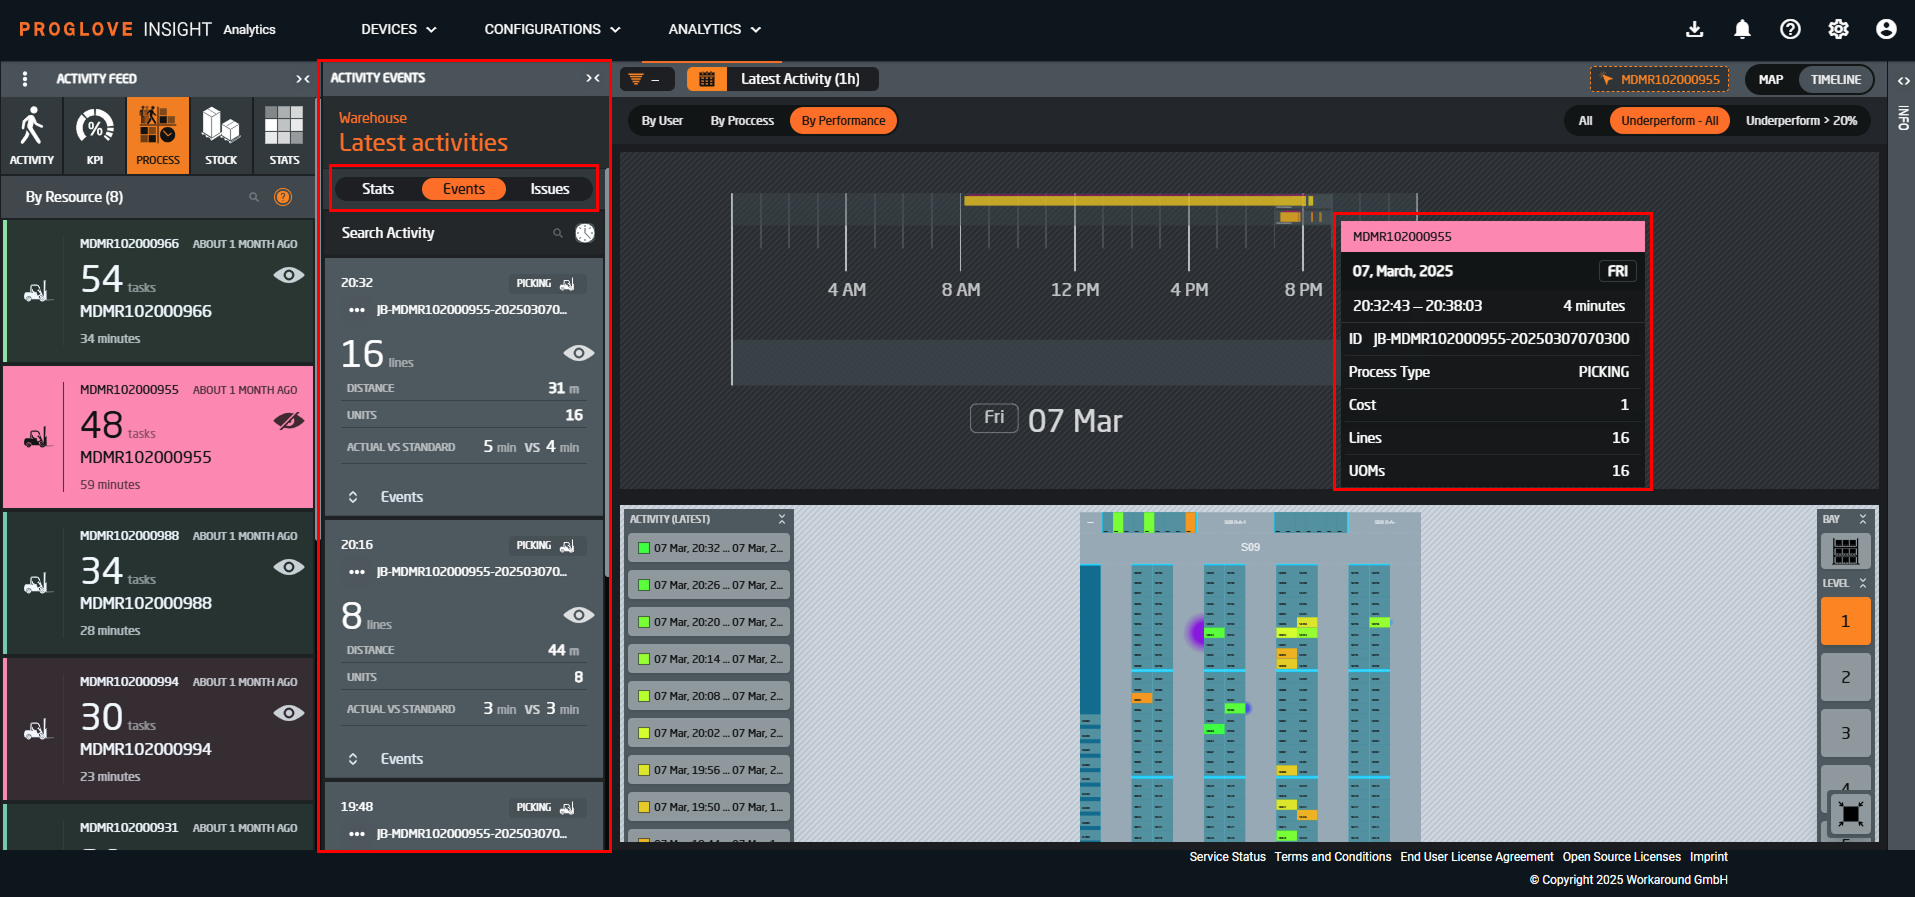
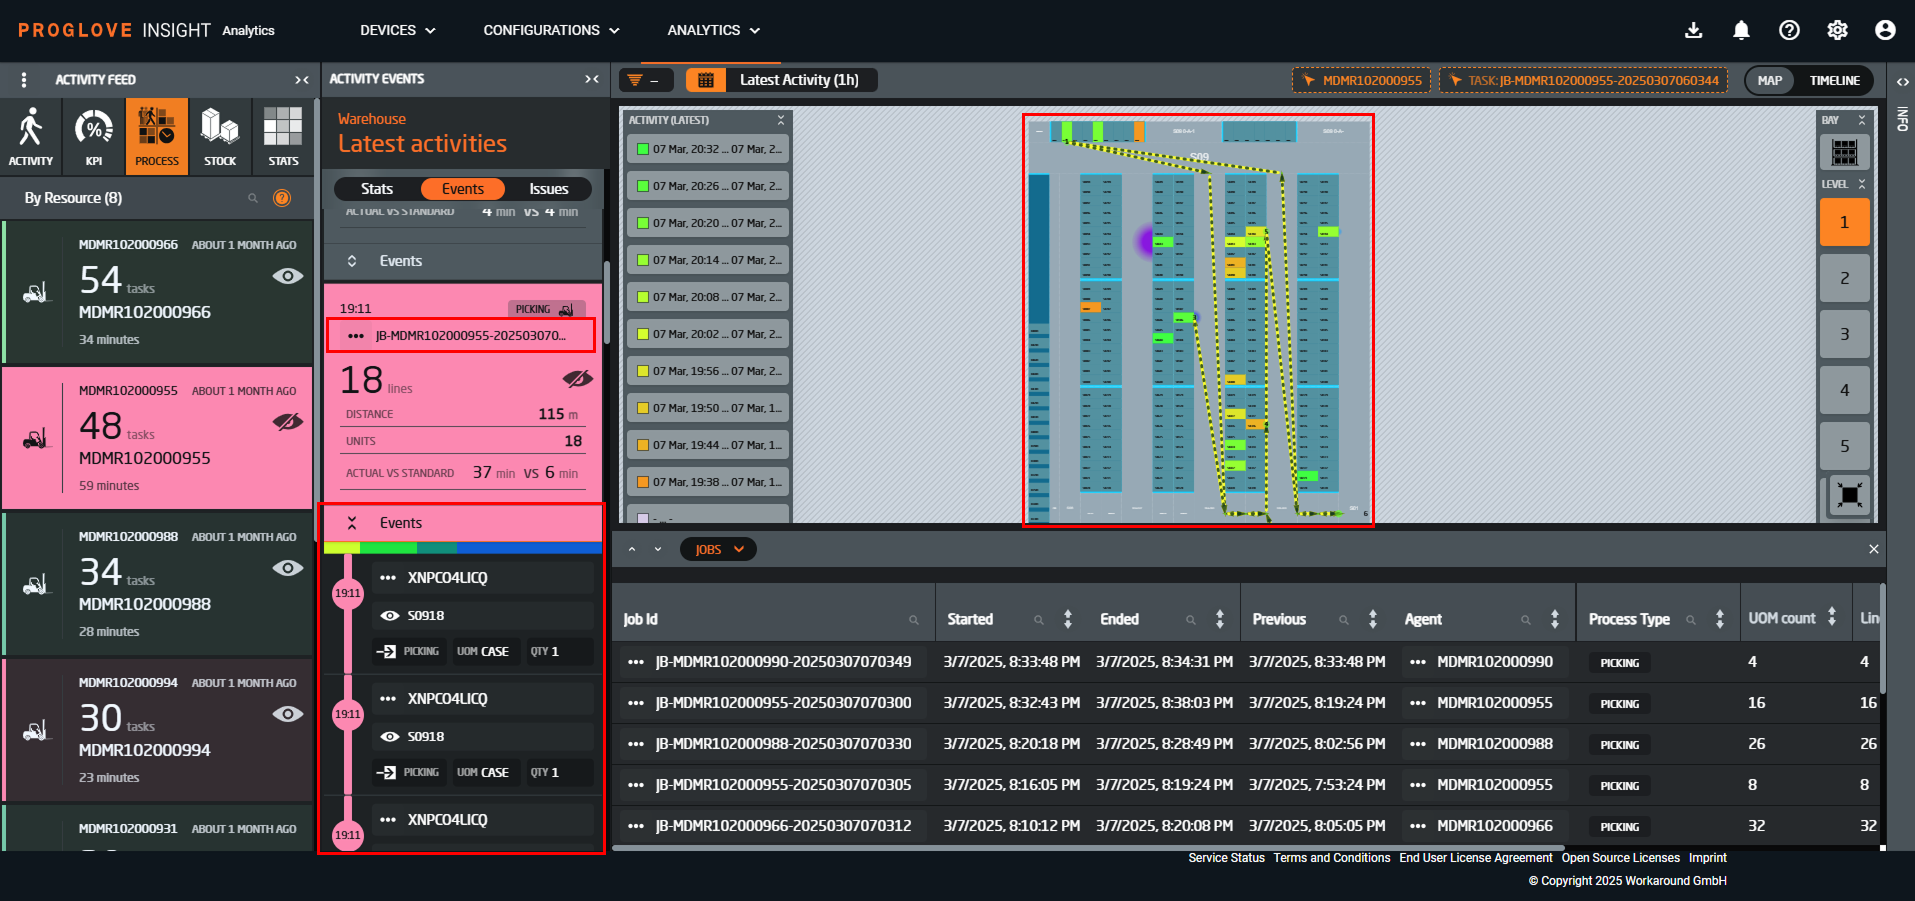
Event activities contain score cards representing all jobs performed by the selected resource. Selecting a card displays the path taken to complete that job on the map to the right, while clicking the three dots next to the job ID opens the job details and its metadata. Clicking Events opens a chronological breakdown and allows you to review each step within that specific activity.
See below for descriptions of performance metrics you can find within each score card:
Metric | Definition |
|---|---|
Lines | Total number of order lines processed. |
Distance | Total travel distance. |
Units | Total items handled. |
Actual vs Standard | Performance comparison between the actual time and a standardized* time value. |
Note
The standard times are simulation‑based reference values, and not an observed or guaranteed benchmark. Standard times are fully configurable by the customer.
Same as Activity and KPI tabs, hovering over elements will provide more details, while clicking will automatically apply it as a filter. Use filters to focus on specific processes, resources, and time periods.
Stats
The Stats section provides aggregated metrics across multiple dimensions, giving you a complete overview of process efficiency.
Metric name | Definition | Category |
|---|---|---|
Actual Time | Real time spent on a activities. | Time stats |
Standard Time | Expected time based on simulation models. | |
Time Difference | Variance between actual and standard times. | |
Total Distance | Overall movement within the warehouse. | Distance stats |
Total Travel Time | Time spent moving between locations. | |
Start/End Travel Time | Time spent travelling to/from process boundaries. | |
Handling Time | Time spent on manipulation and preparation. | Process stats |
Picking Time | Time dedicated to the core picking activities. | |
Performance (lines/hour) | Productivity rate for order lines. | Performance stats |
Total Lines | Aggregated number of order lines processed. | |
Total Cost | Calculated labor cost for all processes. | |
UPH (Units Per Hour) | Productivity rate for individual units. | |
Avg. Distance Per Line | Movement efficiency metric. | |
Handling Time Per Unit | Processing efficiency metric. |
Use these metrics to benchmark performance, identify top performers, and establish realistic targets.
Issues
The system will automatically identify and flag any workflow anomalies. Alerts happen if there are significant deviations from the standardized model (simulated time). For inconsistent process steps, unidentified items or locations, an issue is raised. See below for a few examples of possible issues:
Unknown location: Activities at undefined or incorrect locations
Unknown items: Processing of undefined items
Multiple start/end points: Inconsistent process boundaries
Optimize with process data
Process and performance stats provide key indicators for workforce management and optimization, allowing you to:
identify inefficient workflows by comparing actual vs. standard times
reduce travel distance by optimizing warehouse layout and process design
improve resource allocation based on performance metrics
establish realistic performance targets using historical data
address recurring issues to improve overall operational quality
optimize handling procedures to reduce processing time
Note
Regular review of process data is essential for continuous improvement. Consider exporting data periodically for trend analysis across longer timeframes.